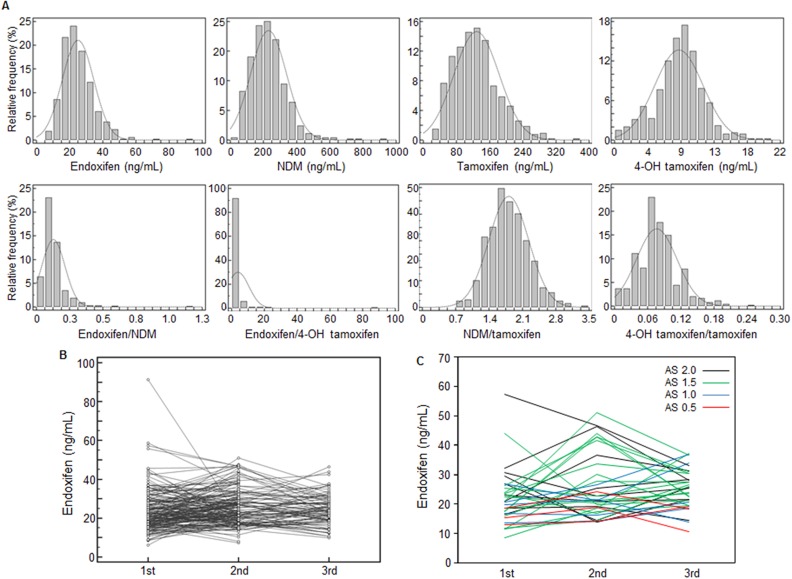
Figure 2. Distribution of and changes in the concentrations of tamoxifen and its metabolites.
(A) Histogram of tamoxifen metabolite concentrations (ng/mL) and ratios in 550 plasma specimens. Tamoxifen metabolites and ratios showed wide variation (CV, 30-274%). (B) Plasma concentrations of endoxifen at 3-month intervals in 179 patients; 0.23- to 4.87-fold changes were observed in endoxifen concentrations over the 3-month interval. (C) Plasma concentrations of endoxifen according to CYP2D6 AS in 33 patients. Endoxifen concentrations at 3-month intervals showed wide variations regardless of the CYP2D6 AS. AS, activity score; NDM, N-desmethyltamoxifen; 4-OH tamoxifen, 4-hydroxytamoxifen.

