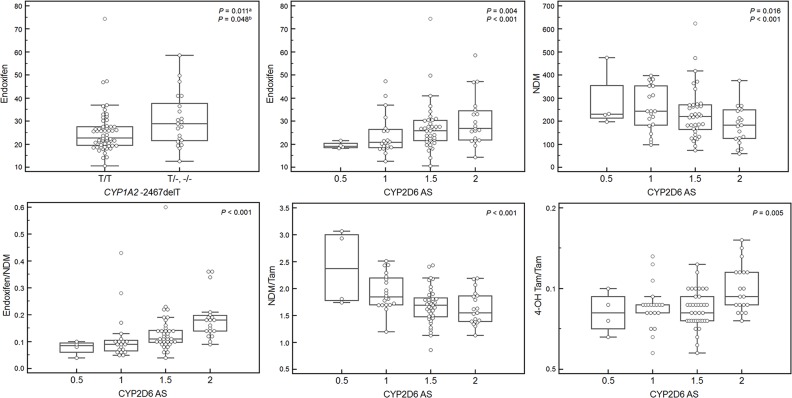
Figure 3. Concentrations of plasma tamoxifen metabolites and their ratios according to CYP1A2 -2467delT genotype and CYP2D6 activity score (AS).
Box-plots show differences in endoxifen concentration according to classification based on the genotype of CYP1A2 -2467delT and differences in the concentrations of tamoxifen metabolites and their ratios according to CYP2D6 AS among associations with multivariable P-value less than 0.050 in Table 5. The other statistical significances between metabolite concentrations and genotypes or predicted phenotypes are presented in Table 5. Deletion of nucleotide T in CYP1A2 c.-2467 resulted in higher endoxifen concentrations than wild type. The concentrations and ratios of endoxifen, endoxifen/NDM, and 4-OH tamoxifen/tamoxifen were positively correlated with CYP2D6 AS, and NDM and NDM/tamoxifen were negatively correlated with CYP2D6 AS. NDM, N-desmethyltamoxifen; 4-OH tamoxifen, 4-hydroxytamoxifen; Tam, tamoxifen.
aMultivariable P-value including genetic variants with univariate P-values < 0.100 and body mass index.
bP-value from multivariable analysis including tamoxifen concentration as an indicator of compliance and drug absorption.

