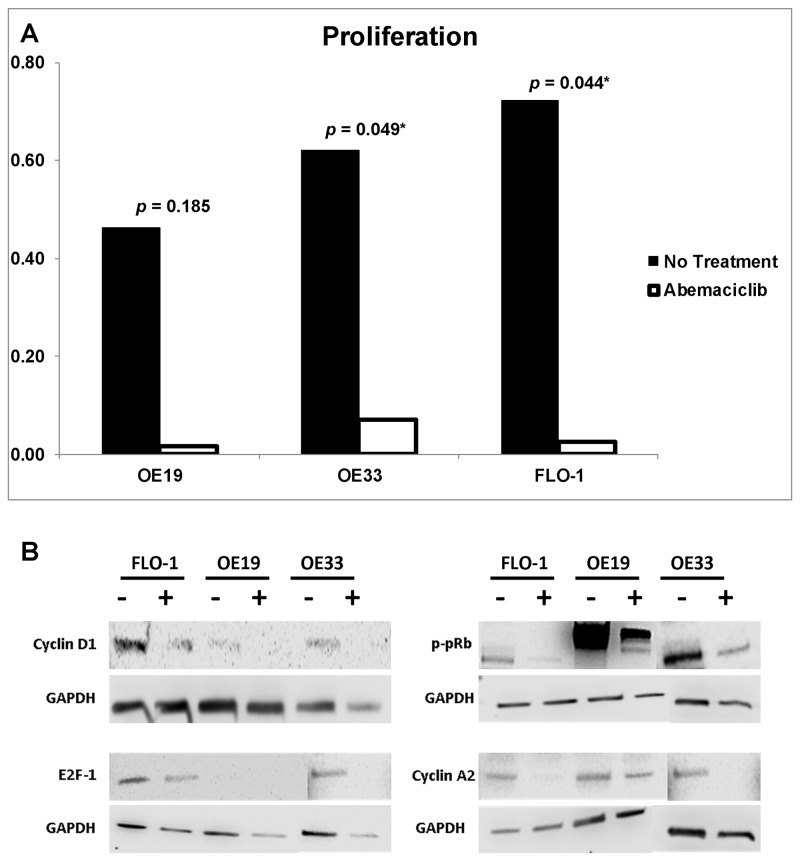
Figure 3.
(A) Proliferation. Esophageal adenocarcinoma cell lines OE19, OE33, and FLO1 were utilized for proliferation analysis by BrdU ELISA using an ED50 of 10μM, 6μM, and 14μM, respectively. Proliferation significantly decreased in both OE33 and FLO1 after treatment with abemaciclib. (B) Western blot. Protein expression analysis revealed downregulation of Cyclin D1, E2F1, p-pRb, and Cyclin A2 across all cell lines due to treatment with abemaciclib (+) when compared to untreated (-).

