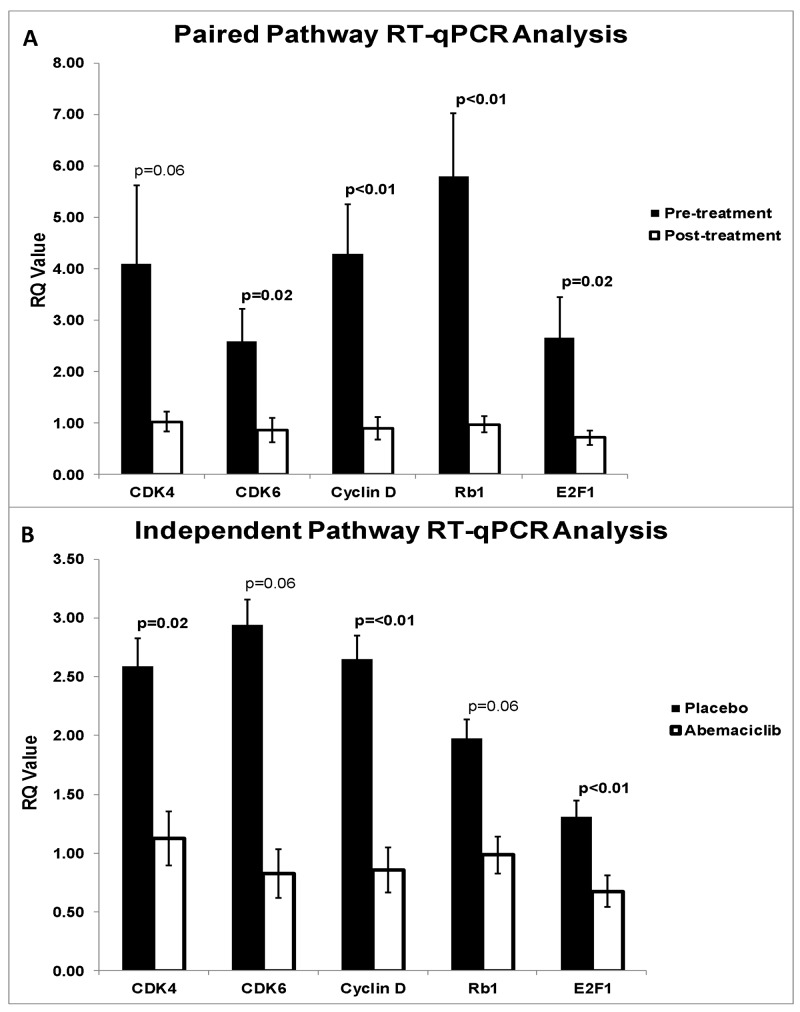
Figure 6.
(A) qRT-PCR pre versus post treatment pathway analysis. Pre-treatment biopsy samples were compared with harvested samples post-abemaciclib administration. Paired analysis demonstrated downregulation of CDK4 (p=0.057), CDK6 (p=0.017), Cyclin D (p<0.01), Rb1 (p<0.01), and E2F1 (p=0.025). (B) qRT-PCR placebo versus abemaciclib pathway analysis. Endpoint placebo and abemaciclib treated samples were compared. Independent analysis demonstrated downregulation of CDK4 (p=0.016), CDK6 (p=0.064), Cyclin D (p<0.01), Rb1 (p=0.56), and E2F1 (p<0.01).

