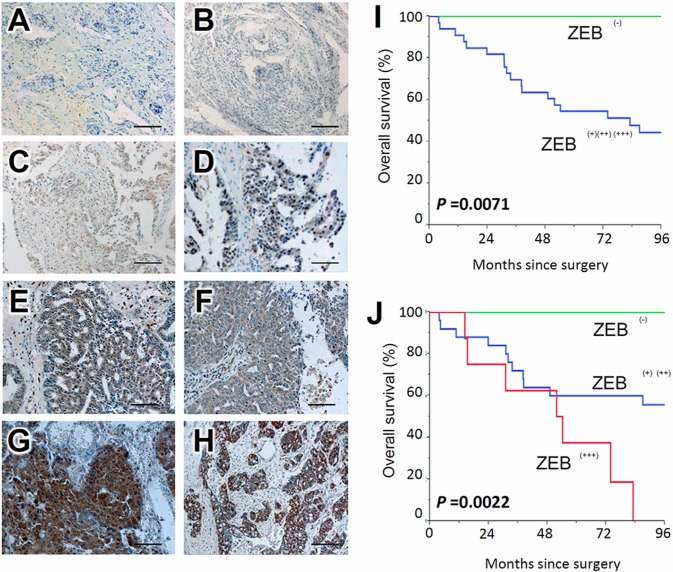
Figure 1. Survival impact of ZEB1 expression in EOC tissues.
Immunoreactivity of ZEB1 observed in surgical EOC samples (paraffin sections), positive or negative expression of ZEB1 in EOCs. (A, B) negative, (C, D) weakly positive, (E, F) moderately positive, (G, H) strongly positive; magnification × 100. (I, J) Kaplan-Meier overall survival curves for primary EOCs according to immunoexpression of ZEB1. Two-group comparison (I): Green line represents negative ZEB1 expression (negative: N = 7). Blue line represents positive ZEB1 immunoexpression (weekly-strongly positive: N = 33) (P = 0.0071). Three-group comparison (J): Green line represents negative ZEB1 expression (negative: N = 7). Blue line represents positive ZEB1 immunoexpression (weekly-moderately positive: N = 28). Red line represents positive ZEB1 immunoexpression (strongly positive: N = 8) (P = 0.0022).

