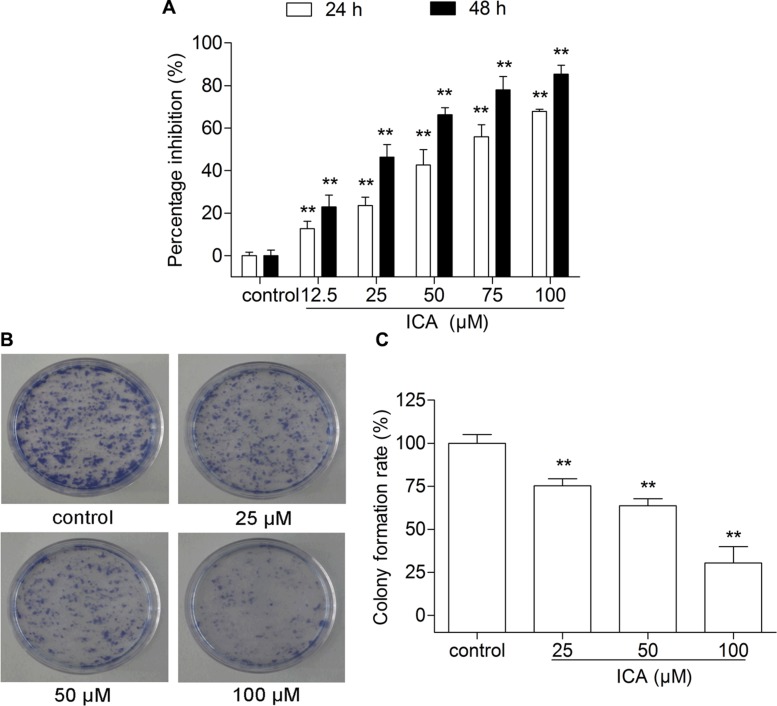
Figure 1. The effect of ICA on B16 cell proliferation and cell colony formation.
(A) The inhibition rate was determined by MTT assay after 24 or 48 h of ICA treatment. (B) Representative images of cell colonies after Giemsa staining. (C) The values of colony formation inhibition rate among the four groups. All data are presented as the mean ± S.D. of three independent experiments. **P < 0.01 compared with control group.

