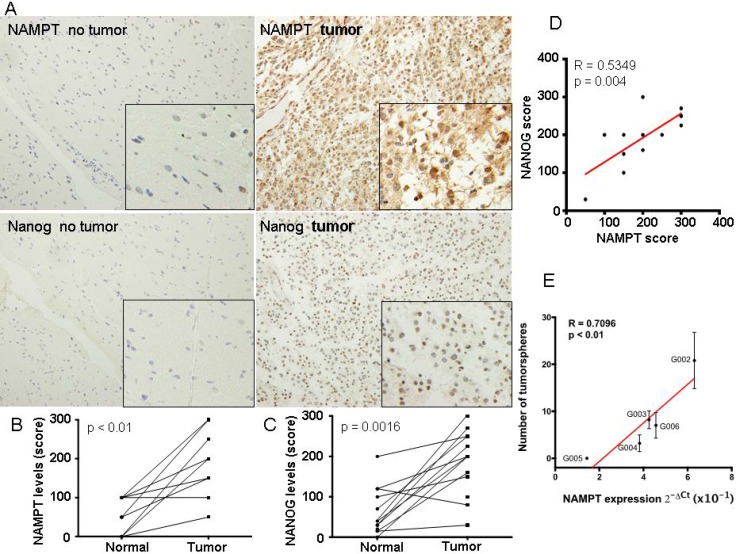
Figure 4. NAMPT expression correlated with high levels of cancer stem cell-like cells in glioblastoma extracted directly from patients.
(A) We first took 14 glioblastoma tumor samples directly from patients as well as matched non-tumor samples and generated a tissue microarray, TMA. These TMAs were stained for NAMPT and Nanog according to M&M. In these samples we evaluated the expression of NAMPT and Nanog, as surrogated marker of cancer stem cell-like levels of these tumors. (B) Levels of NAMPT and (C) Nanog were related in matched samples, from the same patient. (D) Evaluation of the correlation between matched samplesof NAMPT and Nanog. There was a clear correlation (pearson r = 0.53, p < 0.01) between the expression of Nanog and NAMPT. (E) We took 5 fresh glioblastoma samples from patients. After tissue disaggregation, we directly measured NAMPT levels by Q-RT-PCR and parallely seeded 3000 cells to measure the number of tumorspheres formed. Then we plotted to establish 1 to 1 correlation, between the level of NAMPT and the number of tumorspheres. We found a strong direct correlation of the tumorsphere number and NAMPT levels for each tumor.

