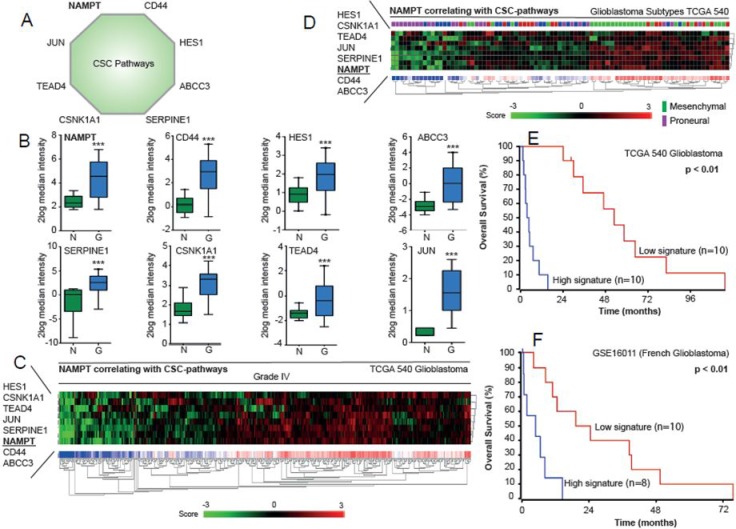
Figure 7. Analysis of NAMPT-related signature in the TCGA database.
(A) Nampt-derived signature is represented. (B). Relative expression leves of each gene are represented in normal brain vs glioma samples. (C) Nampt-derived signature levels clasiffy Grade IV gliobastoma samples. (D) Nampt-derived signature levels classify the different subtypes of Glioblastoma according to the whole dataset of Glioblastoma TCGA dataset. (E–F) Overall survival probability comparing the patients showing low expression signature vs high expression signature. R2 expression analysis of the gene signature triggered by NAMPT in the TCGA 540 (E) or French (F) glioblastomma databases in a biased cohort of patients with high signature expression [n = 10] and low signature expression [n = 10] shows poor survival in patients [p < 0.01 with log-rank analysis].

