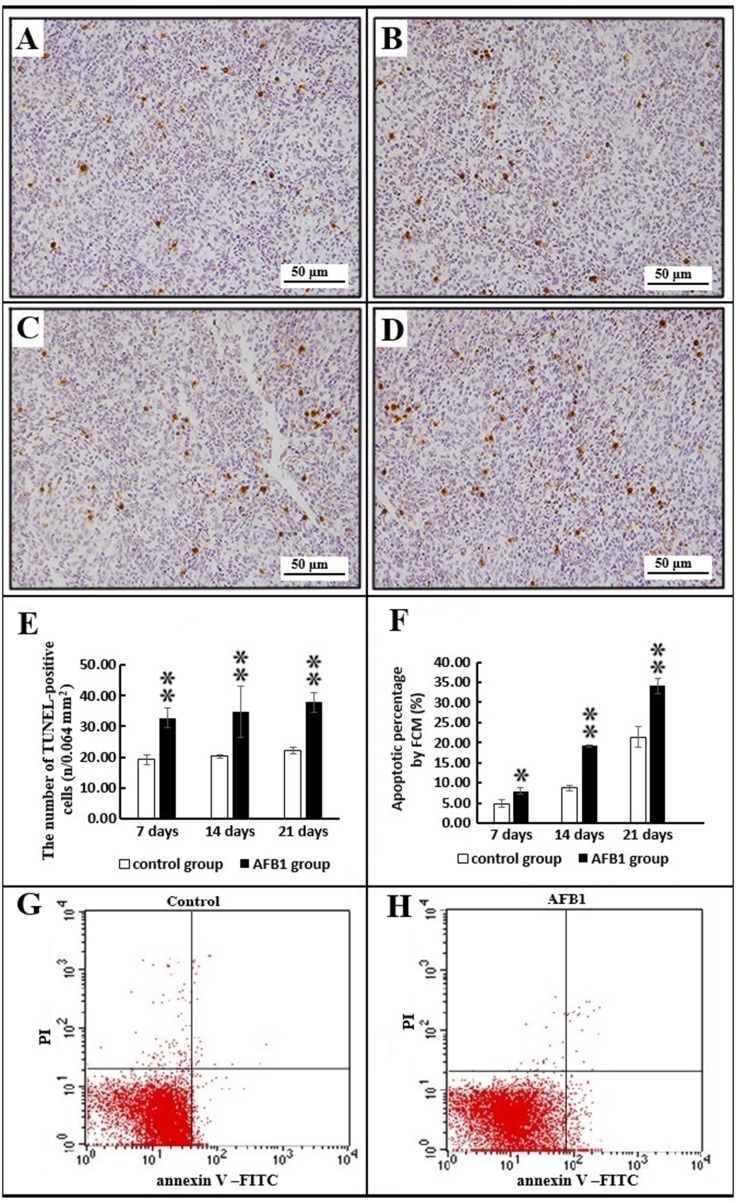
Figure 4. The splenocyte apoptosis by TUNEL immunohistochemistry and flow cytometry analysis.
Note: (A–D) TUNEL-positive cells in the control group (A) at 14 days, and AFB1 groups (B–D) at 7, 14 and 21 days of age (TUNEL assay, Scale bar: 50 μm). (E) The numbers of TUNEL-positive cells (microscopic quantitative analysis). Data are presented with the means ± standard deviation (n = 6). (F) Apoptotic percentages of splenocytes by flow cytometry assay. Data are presented with the means ± standard deviation (n = 6). (G–H) Scattergram of apoptotic splenocytes obtained by flow cytometry assay in the control group (G) and AFB1 group (H) at 21 days of age.

