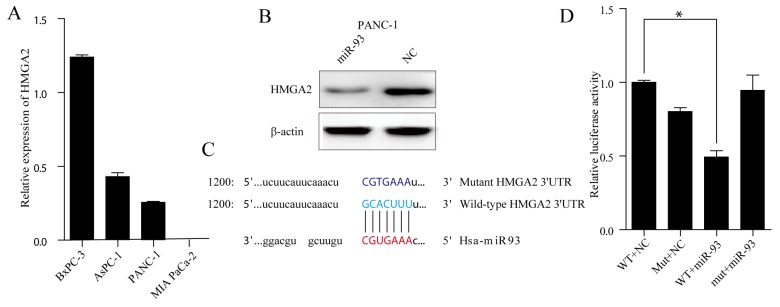
Figure 5.
(A) RT–qPCR analysis of HMGA2 expression in four PDAC cell lines (BxPC-3, AsPC-1, PANC-1 and MIA PaCa-2). Transcript levels were normalized to GAPDH expression. (B) Western blot analysis of HMGA2 level in PANC-1 cells after transfecting NC and miR-93 mimic Cell protein was harvested 48h posttransfection and used for western blot analysis. (C) The binding region between wild-type HMGA2 3’UTR (base sequence in pale bule) and candidate microRNA (has-miR-93) (base sequence in red), and the mutated sites of HMGA2 3’UTR (base sequence in navy blue). (D) PANC-1 cells were co-transfected with miR-93 mimic and with either Wild-Type or MUT HMGA2 3’UTR reporter vector. Luciferase activities were tested 48h after transfection.

