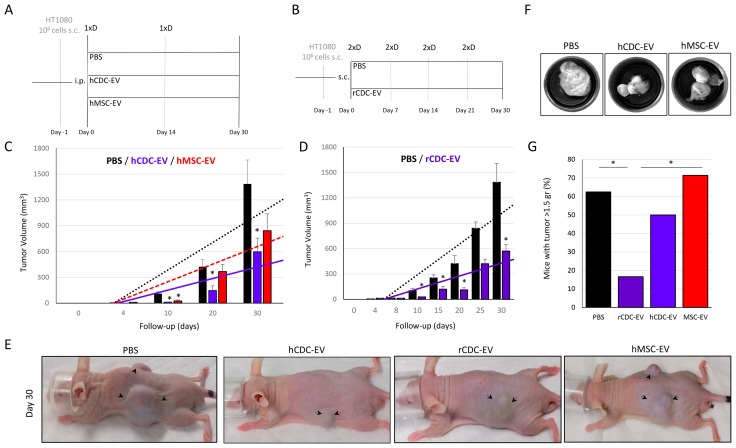
Figure 2. CDC-EVs decrease fibrosarcoma growth in mice.
(A) Study design where systemic (intraperitoneal –i.p.) delivery of human CDC-EVs (hCDC-EV; n=6) was compared to PBS (n=9) and human MSC-EVs (hMSC-EV; n=8) injections. 1xD refers to single dose. (B) Study design where local (subcutaneous, peritumoral – s.c.) delivery of rat CDC-EVs (rCDC-EV; n=6) was compared with local PBS (n=6) injections. 2xD refers to double dose. (C) External tumor growth measured with a caliper in the systemic-delivery protocol, showing a significant decrease in the hCDC-EV vs PBS groups. (D) External tumor growth measured with a caliper in the local-delivery protocol, showing a significant decrease in the rCDC-EV vs PBS groups. (E) Representative images of mice at day 30 with visibly smaller tumors (marked with arrows) in animals treated with human- and rat-CDC-EVs compared with the other two control groups (PBS and MSC-EV). (F) Representative images of the harvested tumors. (G) Bar graph showing the proportion of mice with the heaviest tumors (defined as tumor weigh more than the mean of 1.5 gr in all mice together). * p<0.05. Tumor growth’s bar graphs represent mean (±SEM).

