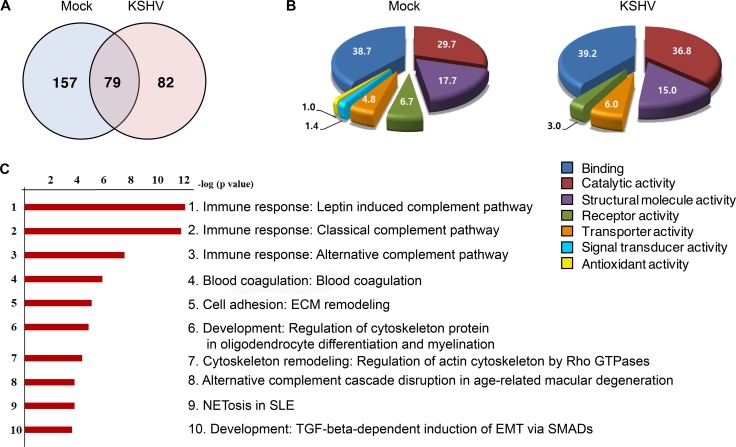
Figure 2. Proteome profile of EVs from mock- and KSHV-infected cells.
(A) Venn diagram depicts the overlap in protein profiles between EVs from mock- and KSHV-infected HUVECs. Seventy-nine proteins are co-expressed in both the groups, whereas, 157 and 82 proteins were unique to mock-infected (Mock) and KSHV-infected (KSHV) group, respectively. (B) The difference in the molecular functions of proteins isolated from mock and KSHV EVs are shown in the pie charts. The numbers indicate the percentages of proteins in relative to total protein. (C) Pathway map analysis of differentially expressed proteins between the mock and KSHV groups. The list is arranged in descending order with the most significant pathway at the top. Bar shows -log p-values.

