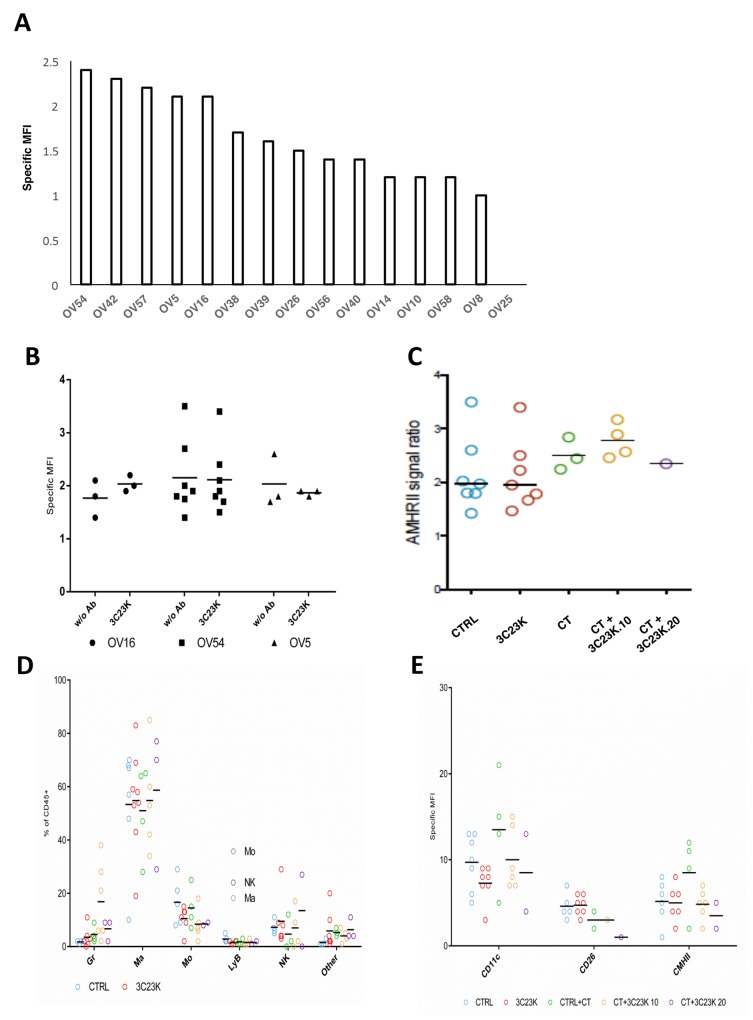
Figure 2. Cytrofluometric analysis of ovarian cancer cell lines and PDXs.
(A) AMHRII expression of various ovarian cancer cell lines and PDXs. The expression of receptor was expressed by its specific Mean Fluorescent Intensity (MFI: arbitrary unit of signal to noise ratio from measured fluorescence) stated as the Geometric Mean (adapted for logarithmic distributions) of majority human population stained with 3C23K weighted with MFI of this population stained with R565 (non-specific signal). (B) (C) Expression of AMHRII in three OC PDXs at time sacrifice after in vivo administration of 3C23K and/or chemotherapy (CT) (carboplatin + paclitaxel). (D) Immune cell component composition in the OV54 OC PDX after various in vivo treatments. (E) M1/M2 macrophage proportion in the OV54 OC PDX after various in vivo treatments.

