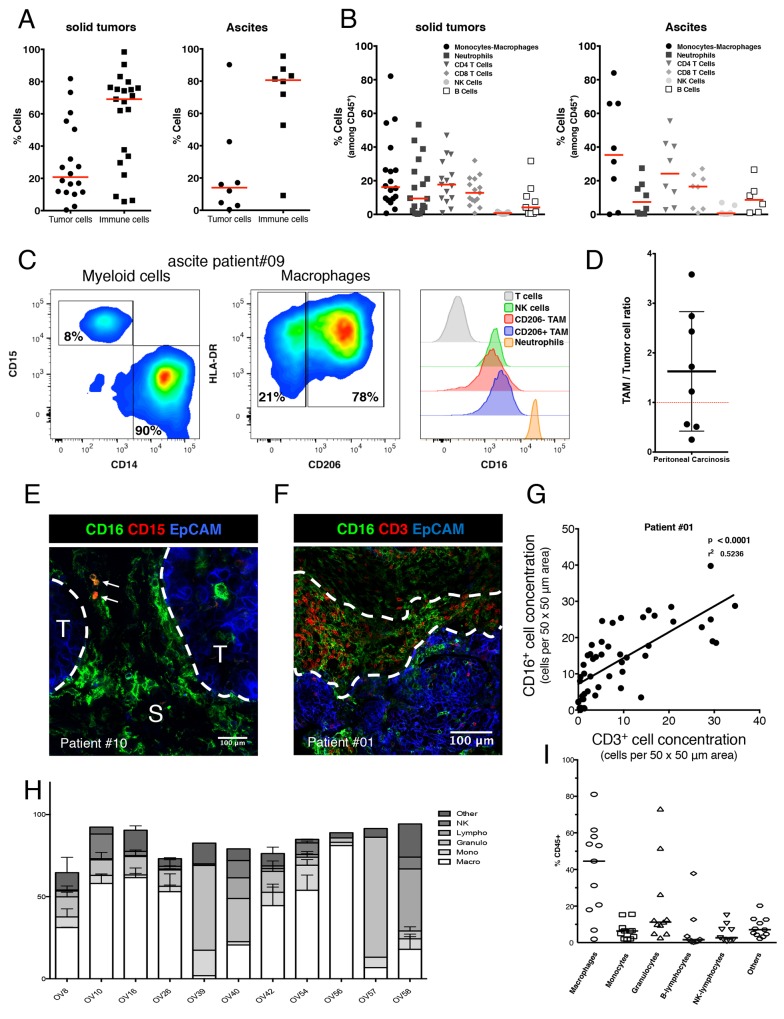
Figure 3. Phenotypic characterization of human ovarian tumors infiltrating immune cells.
(A) Relative quantification of tumor cells (defined as EpCAM+/CD45- cells) compare to immune cells (defined as EpCAM-/CD45+ cells) in 21 solid tumors (left panel) and 8 ascites (right panel) by multiplexed flow cytometry. Results are analyzed after doublet and dead cells exclusion. Data are expressed as the cell percentage within the singlet living population. Each dot represents a different patient and the median is shown (red bar). Both solid tumor and ascites are most frequently composed of a high proportion of immune cells. (B) Immune cell subset characterization in 21 solid tumors (left panel) and 8 ascites (right panel) by multiplexed flow cytometry. Results are analyzed after doublet and dead cells exclusion. Data are expressed as the cell percentage within the singlet living immune cell population (defined as EpCAM-/CD45+ cells). Each dot represents a different patient and the median is shown (red bar). Immune infiltrate of both solid tumor and ascites is composed of two major subsets: Macrophages (TAMs) and T cells (TILs). While NK cells remain scarce. (C) Immune cells composing a representative tumor sample (ascites from patient #09) were analyzed by flow cytometry for TAM phenotype (left and middle panels) and for surface expression of Fc gamma RIII (right panel). (D) Represented E/T ratio as the total CD16 positive immune cells versus tumor cells was measured by flow cytometry in 8 OC patients. The average Effector/Target ratio is 1.8/1(black bar). (E-G) Distribution of TAMs and TILs in the tumor microenvironment: (E) Representative multiplexed immunofluorescence microphotographs showing CD16 expression (green fluorescence channel) compared to CD15 expression (red fluorescence channel) in a fresh human ovarian malignant biopsy (patient #10) Tumor nests were identified by EpCAM expression (T, blue fluorescence channel). S, Stroma. CD16 expressing TAMs are mostly in direct contact with the tumor/stroma border (white dashed lines) and are even able to infiltrate into the core of the tumor nest while neutrophils (CD15+/CD16+ double positive cells, white arrows) are rarely found and more localized in distal stromal areas. Representative of 16 OC patient’s biopsies. (F) Representative multiplexed immunofluorescence microphotographs with CD16 expressing cells including TAMs (green fluorescence channel) compared to CD3 expressing T cells (red fluorescence channel) in a fresh human ovarian malignant biopsy (patient #01). Tumor nest is identified by EpCAM expression (T, blue fluorescence channel). (G) Positive correlation between TAMs and TILs concentration expressed as the number of cells per 50 x 50 μm area. TAMs and TILs tend to localize in the same peritumoral areas fostering cell-to-cell contact between those two populations. (H)(I) Proportion of immmune cells present (CD45+ cells) in various OC PDXs.

