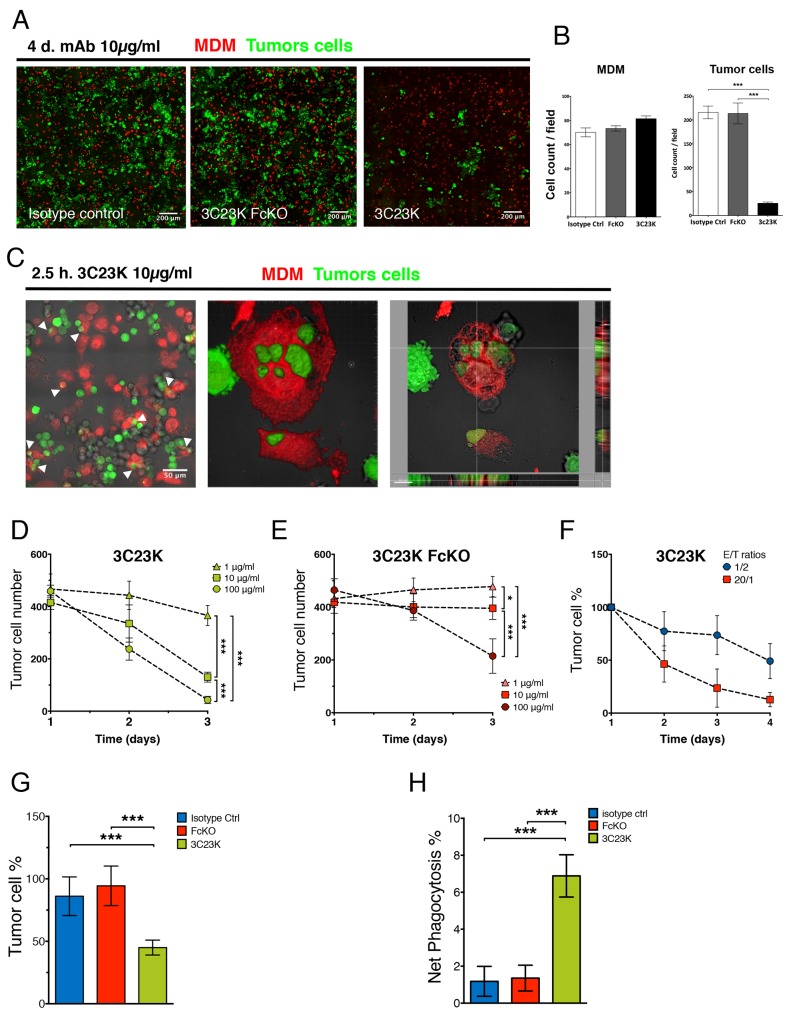
Figure 4. 3C23K eliminates ovarian tumors cells by directing TAM to induce ADCC and ADCP in vitro and ex vivo.
(A) Representative IF microphotographs of MDM2/COV434-AMHRII co-culture after 4 days of treatment with either the irrelevant mAb R565, the anti-AMHRII FcKO or the anti-AMHRII 3C23K. Cell Trace Violet® stained MDM2 are in red and CMFDA® stained COV434-AMHRII cells are in green. (B) Quantification of MDM2 and COV434-AMMHRII tumor cells after 4days of treatment with either the irrelevant mAb R565, the anti-AMHRII FcKO or the anti-AMHRII 3C23K. Data are expressed as the cell count per field of view (FOV) +/- Standard Deviation. A student t-test was performed. *** p < 0.005. (C) Representative IF microphotographs of MDM2/COV434-AMHRII co-culture after 2.5h of treatment with the anti-AMHRII mAb 3C23K. Cell Trace Violet® stained MDM2 are in red and CMFDA® stained COV434-AMHRII cells are in green. (Left panel) White arrows indicate phagocytosis events, (Middle panel) reconstituted 3D volume view, (Right panel) reconstituted 3D section view. 3C23K targeted tumor cells are engulfed by MDM2 macrophages. (D-F) MDM mediated ADCC in vitro assay by quantification of viable COV434-AMHRII tumor cells during 4 days of treatment. (D-E) ADCC dose responses. MAb concentrations = 1 (triangles), 10 (squares), and 100 μg/ml (circles), E/T ratio = 1/2. Data are expressed as the numbered tumor cell +/- Standard Deviation. P-values * < 0.05, *** < 0.001. (Triplicates). (D) 3C23K mAb dose response. (E) 3C23K-FcKO mAb dose response (F) Kinetic response with varying E/T ratios. E/T ratio = 1/2 (blue circles) or 20/1 (red squares), mAb concentration = 10μg/ml. Data are expressed as the tumor cell percentage normalized at day1 +/- Standard Deviation. (G-H) Ex vivo mAb assays of mAb anti-tumor response with total primary cells from OC patient’s ascites (n=2) co-cultured with COV434-AMHRII tumor cells treated with either the irrelevant mAb R565 (blue bars), the anti-AMHRII FcKO (red bars) or the anti-AMHRII 3C23K (green bars). (G) ADCC ex vivo assay by quantification of viable COV434-AMHRII tumor cells after 24 hours of mAb treatment. Data are expressed as the tumor cell percentage +/- Standard Deviation. P-values *** < 0.001. (H) ADCP ex vivo assay by quantification of COV434-AMHRII tumor cells engulfed by primary macrophages from OC patient ascites after 24 hours of mAb treatment. Data are expressed as the CMFDA stained tumor cell percentage into the CD14 positive cell fraction of total primary ascites cells +/- Standard Deviation. P-values *** < 0.001.

