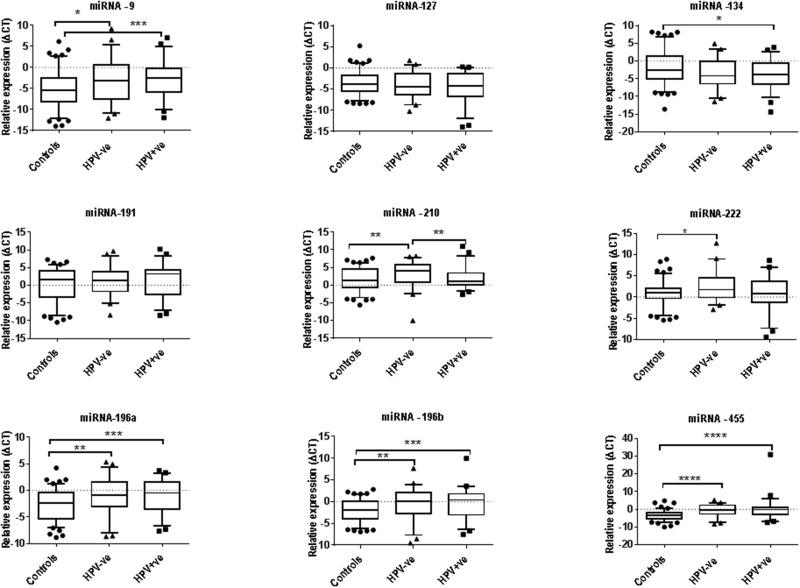
Figure 1. The expression levels of nine miRNA in saliva collected from healthy control (n=113) as well as HPV-negative (n=47) and HPV-positive (n=54) by RT-qPCR.
SNORD-96A was used as a normerliser. Statistically significant differences were determined using Mann Whitney U Test. Significant differences are denoted as *P<0.05; **P<0.01; ***P<0.001 and ****P<0.0001.

