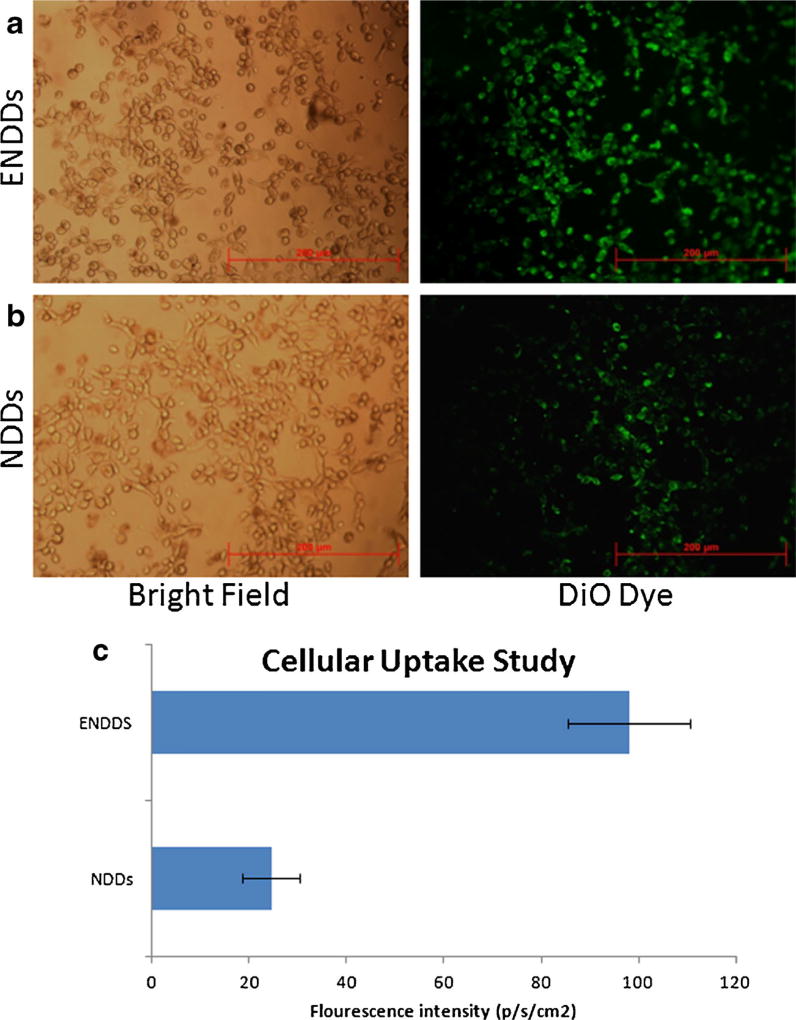
Fig. 4.
Cellular uptake study, microscopic images: fluorescent images of (a) ENDDs, (b) NDDs containing DiO dye after 2 h of incubation with A549 cells and (c) quantification of cellular uptake of fluoresce. Three different area were photographed for three different expeiments and images were analyzed by ImageJ. Data represented as mean ± SD. (n=9) (*, p<0.05, significantly different).

