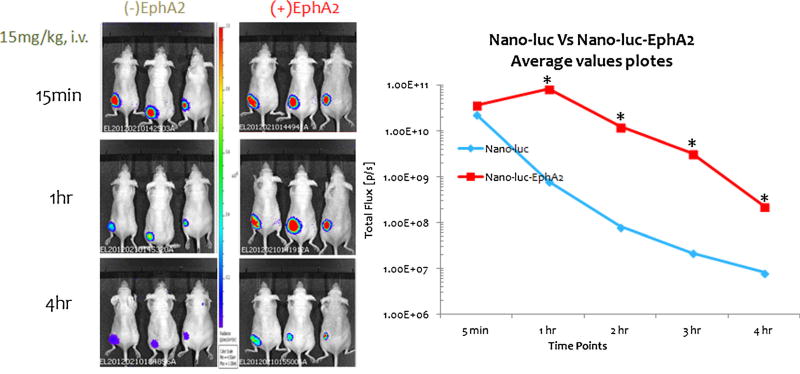
Fig. 8.
Tumor Imaging in mice with orthotopic 4T1-luc2 tumors using 15 mg/kg luciferin equivalent NDDs and ENDDs. (a) Bioluminescent signals taken at different time point in a 4T1-luc model. (b) Total flux of bioluminescence Vs time plot following IV injection of NDDs and ENNDs. (p<0.05, statistical significance of the difference in total flux of treatment groups) (*, significantly different from (NDDs) Nano-luc). Data presented are means average (n=3). This experiment was repeated twice.

