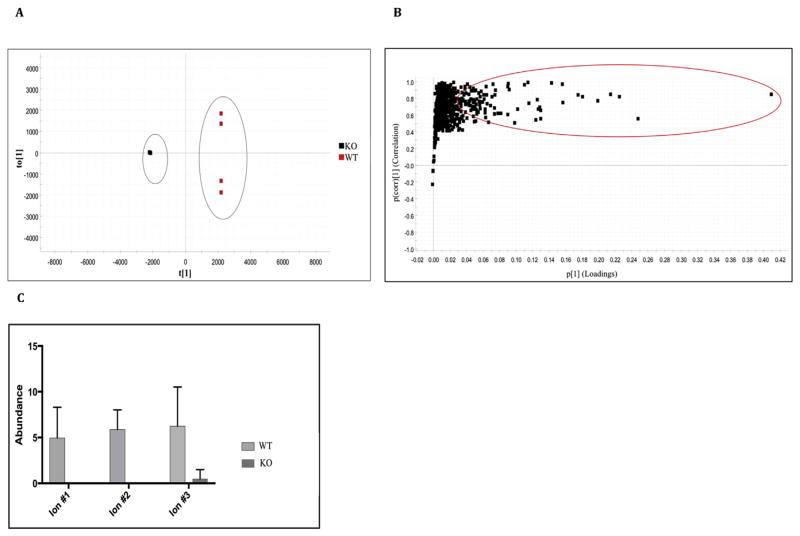
Fig. 4.
A) OPLS-DA scores plot displaying the separation for Aldh16a1 knockout (KO, black squares) and wild-type (WT, red squares) mice. They grey ovals show the separation of the two groups. B) S-Plot displaying ions of interest in KO (−1, lower left side) and WT mice (+1, upper right side). Ions of interest were selected from 42,608 metabolic features for KO (−1, left side) and WT (+1, right side) mice in total. Statistically significant ions (correlation coefficient (pcorr value) > 0.8 and p < 0.05) are highlighted by the red circle. C) Ion abundance of three selected ions in KO and WT mice. Ions 1 and 2 are completely absent from KO mice, while ion 3 has very low ion abundance in KO mice. Data represent mean and associated SD (N = 4). (For interpretation of the references to colour in this figure legend, the reader is referred to the web version of this article.)

