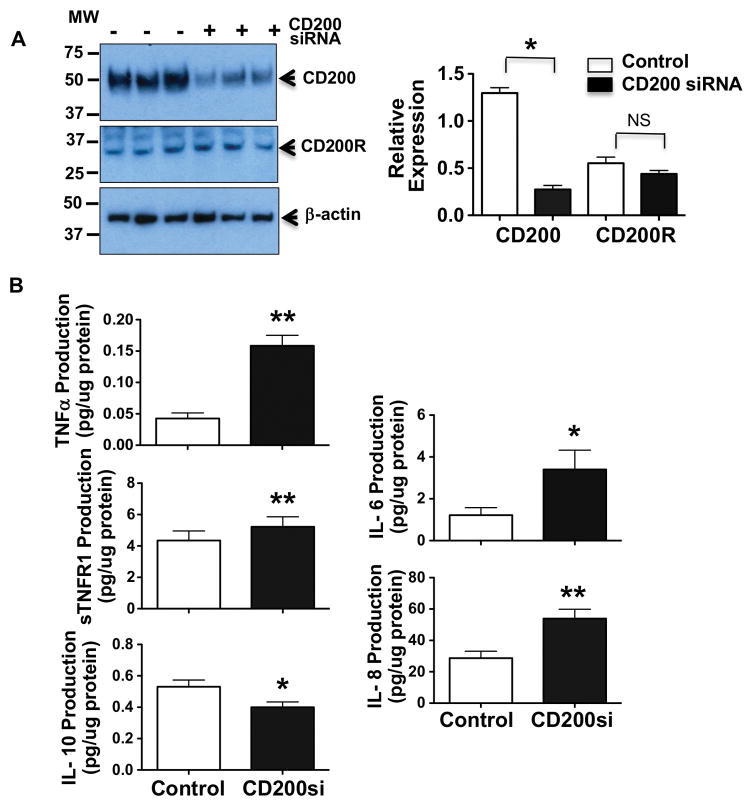
Figure 4. Effects of CD200 inhibition on TNFα, sTNFR1, IL-6, IL-8, and IL-10 production in trophoblasts form normal placentas.
A: CD200 and CD200R expression in trophoblasts transfected with or without CD200 siRNA (50nM). Molecular weight marker is shown on the left of the gel scan for CD200, CD200R and β-actin. The bar graph shows relative density of protein expression for CD200 and CD200R after normalization with β-actin in each sample. * p<0.05, siCD200 vs. control. B: TNFα, sTNFR1, IL-8, IL-6, and IL-10 production in placental trophoblasts transfected with or without CD200 siRNA, respectively, * p<0.05 and ** p<0.01: siCD200 vs. control. Data are mean ± SE from 5–7 independent experiments. Inhibition of CD200 expression by CD200 siRNA results in increased TNFα, sTNFR1, IL-6, and IL-8 production, and decreased IL-10 production by primary isolated trophoblasts from normotensive placentas.

