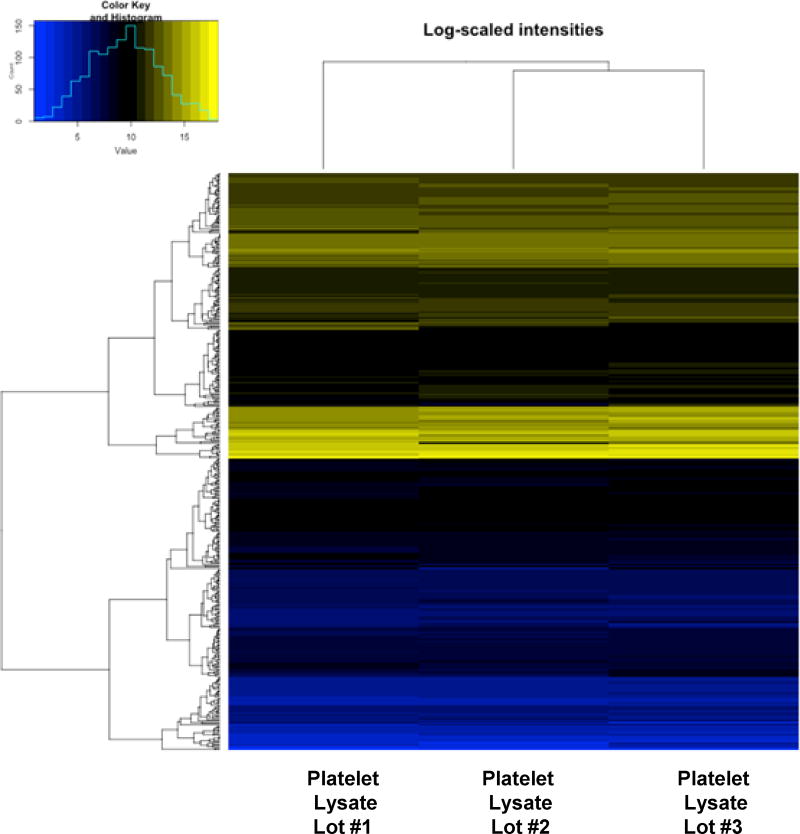
Figure 4. Hierarchical heat map clusteri analysis showing individual protein expression levels in PL-S lots.
Cluster analysis was performed for 3 different lots of PL-S. Low expression protein values are represented as blue, high expression protein values are designated as yellow, and intermediate values are black. Dendrogram shows the similarity of the groups.

