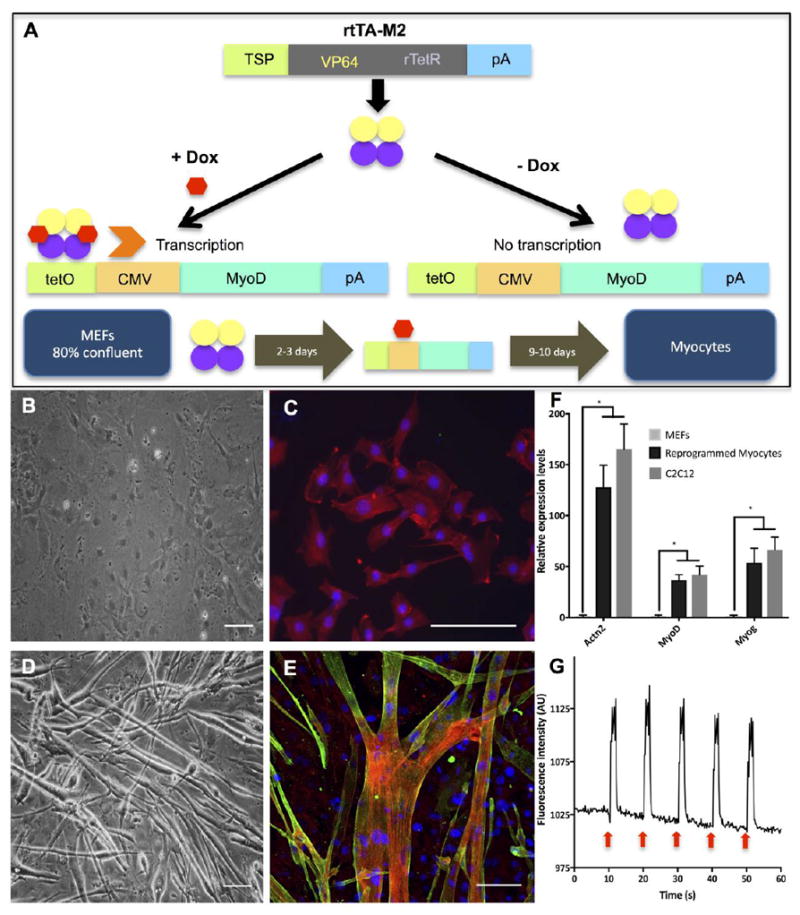
Figure 3. Derivation and characterization of direct reprogramming of MEFs into skeletal myocytes.

(A) The diagram showing rtTA-M2 lentiviral construct and a lentiviral construct containing TetO/CMV-MyoD. A tetracycline inducible system via rtTA-M2 was activated by doxycycline and initiated MyoD transcription. Overexpression of MyoD induced reprogramming of MEFs into skeletal myocytes. (B), (C) Brightfield and fluorescence images of MEFs after 12 days in MIX differentiation media. Actinin was not found in MEFs. Red, green and blue represent actin, actinin and DAPI, respectively. (D), (E) Brightfield and fluorescence images of MEF-transdifferentiated myocytes showed multinucleated myotubes and the presence of actinin protein after 12 days in MIX differentiation media. Red, green and blue represent actin, actinin and DAPI, respectively. Scale bar: 100 μm. (F) qRT-PCR analysis showed relative expressions of important muscular genes found in MEFs, reprogrammed myocytes and C2C12 myoblasts. Expression levels of each gene were normalized by the expression levels found in MEFs. Quantitative data presented as mean ± SD. Statistical significance was evaluated with the Student’s t-test (*p < 0.05, n = 5 biological replicates) (G) A diagram showing calcium transients of MEF-transdifferentiated myocytes being electrically stimulated every 10 seconds as shown by red arrows. Myocytes showed significant increase of fluorescence intensity corresponding to electrical stimulation. (See Supplementary Video S1)
