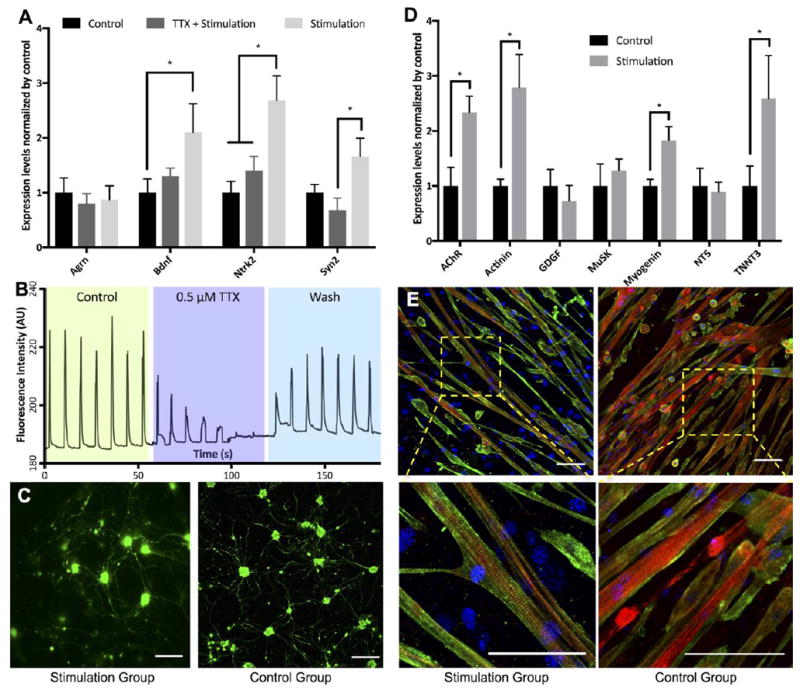
Figure 4. Effects of electrical stimulation on motoneurons and skeletal myocytes.

(A) qRT-PCR analysis showed normalized expression levels of important neuronal genes of motoneurons found in control, electrical stimulation with TTX in culture medium and electrical stimulation groups. (B) Calcium transients during electrical stimulation. The trace consisted of 3 × ~60 seconds recording spliced together. Two electrical stimuli of 0.2 seconds apart were delivered every 10 seconds. The first section was the control, second section was in the presence of TTX and the last section was after 5 minute wash. (C) Florescence images showed the morphology of GFP+ motoneurons in culture. (D) qRT-PCR analysis presented elevated relative expressions of important muscular genes of stimulated myocytes compared to those of control group after 12 days in culture. The expression levels of Chrnb1, Actn2, Myog and Tnnt3 found in stimulated myocytes were significantly increased compared to those of the control group. (E) Florescence images showed the morphology of myocytes in both study groups. Striated sarcomeres indicating mature myocytes were commonly found in myotubes from stimulation group. Red, green and blue represent actin, actinin and DAPI, respectively. Scale bar: 100 μm. Quantitative data presented as mean ± SD. Statistical significance was evaluated with the Student’s t-test (*p < 0.05, n = 5 biological replicates).
