
Figure 5.
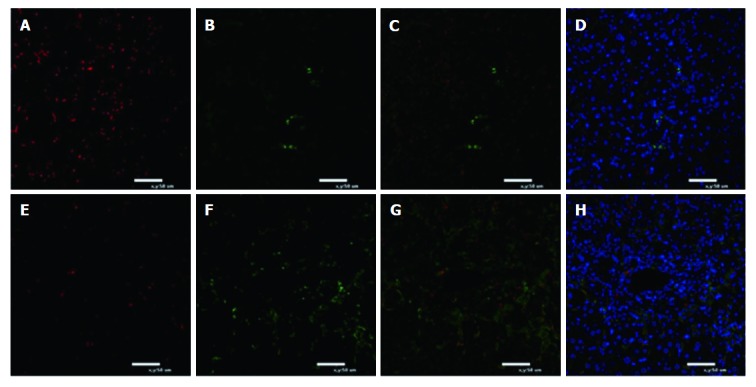
Immunofluorescence for polarization of macrophages in liver tissue. A-D: Death group after mesenchymal stem cell (MSC) treatment; E-H: Survival group after MSC treatment. Green fluorescence indicates CD163+ macrophages. Red fluorescence indicates CD68+ macrophages. Nuclei are stained blue with DAPI. Immunofluorescence for M1 macrophages reacting to CD68 and M2 macrophages reacting to CD163 is shown (n = 5).