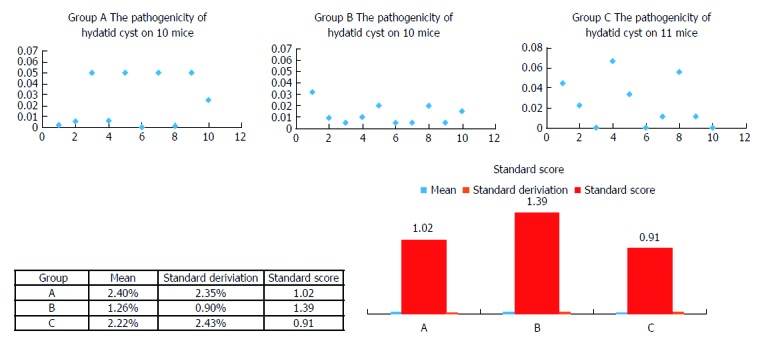
Figure 4.

Injection concertation optimization by standard score. The standard score was used in this study to compare the reliability and efficiency of animal models. The normal distribution of groups A, B, and C is shown in upper panel. A standard score of 1.39 of group B indicates that its performance was better compared with groups A (1.02) and C (0.91).
