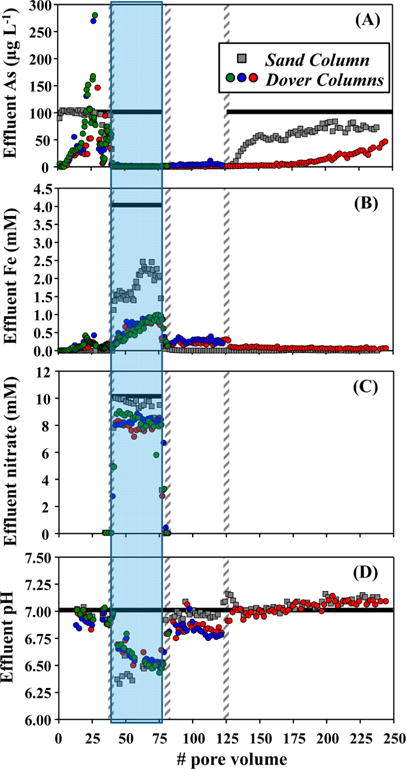
Figure 1.

Effluent (A) As, (B) Fe and (C) nitrate concentrations, and (D) pH, as a function of pore volumes. Green, blue and red symbols represent replicate Dover columns which were sacrificed at different time, whereas grey symbols represent sand column. Vertical bars with diagonal lines represent the switches between experimental stages (Table 1) with nitrate–Fe(II) injection shown with shading. Horizontal black lines represent influent conditions.
