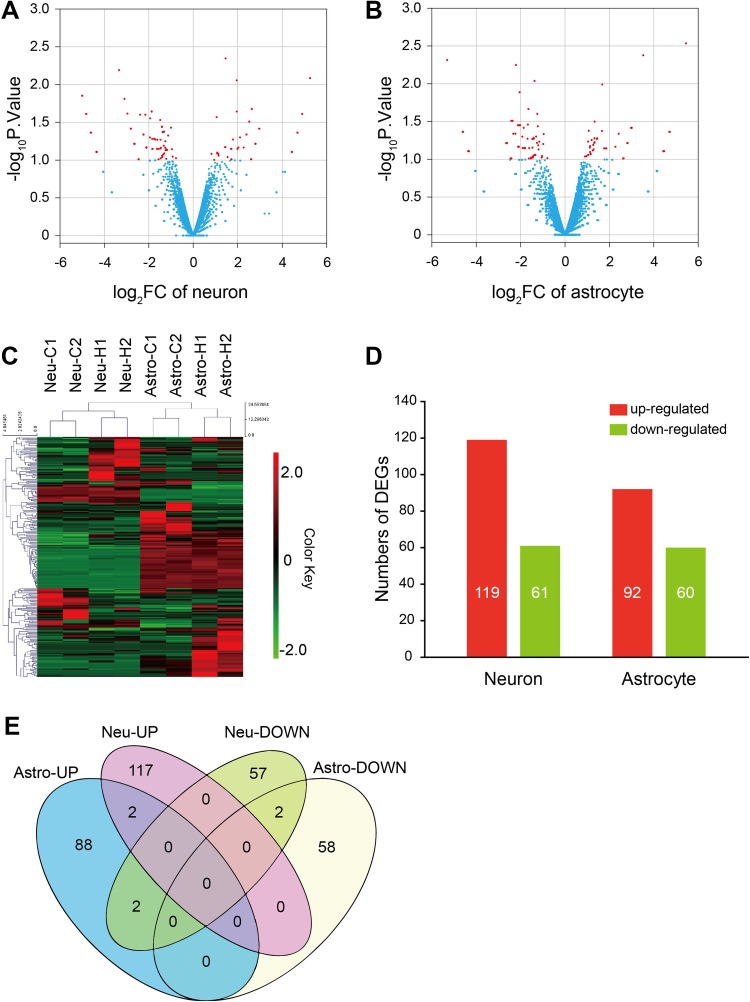
Fig. 2.
Gene transcription changes after high temperature exposure. A, B Volcano plots of DEGs of cultured neurons and astrocytes. Red dots indicate significant DEGs. C Heatmap showing hierarchical clustering of DEGs. D Summary of the significant DEGs in cultured neurons and astrocytes. E Venn diagram of cell-type-specific DEGs in cultured neurons and astrocytes.

