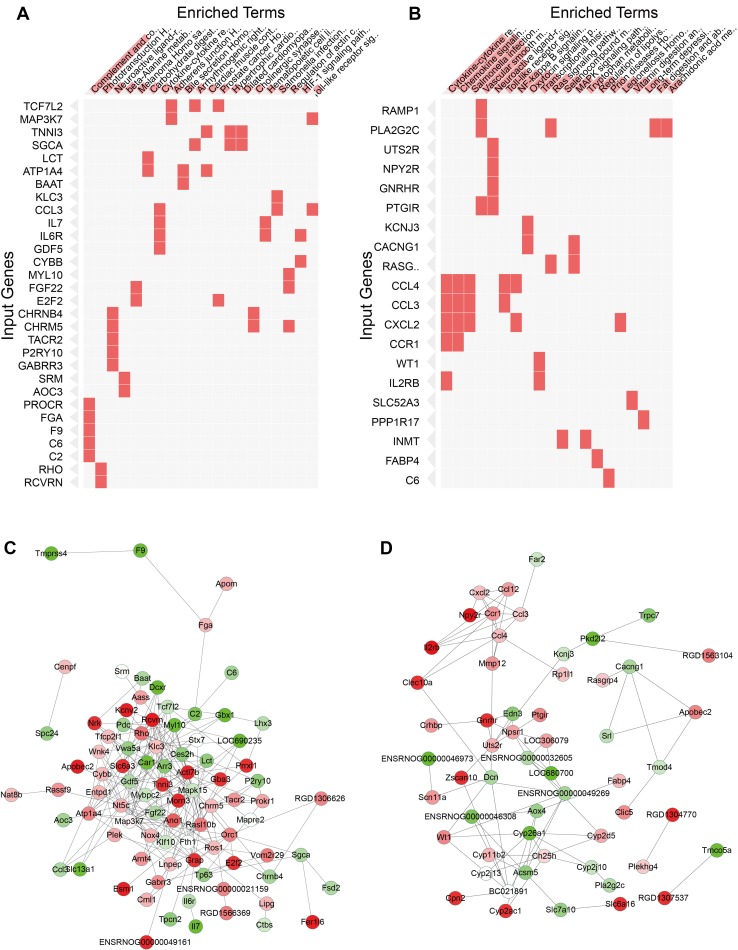
Fig. 4.
KEGG pathway enrichment analyses and protein-protein interaction networks of DEGs. A,B Pathway terms with high Enrichr enrichment scores of DEGs between control and heat-treated cultures of neurons (A) and astrocytes (B) are shown on the horizontal coordinates. Input genes were permuted based on KEGG clustering. C, D Protein-protein interaction network analyses of DEGs of neurons (C) and astrocytes (D) after heat stress. Green, down-regulated genes; red, up-regulated genes. The densities of node colors indicate levels of down-regulation or up-regulation.

