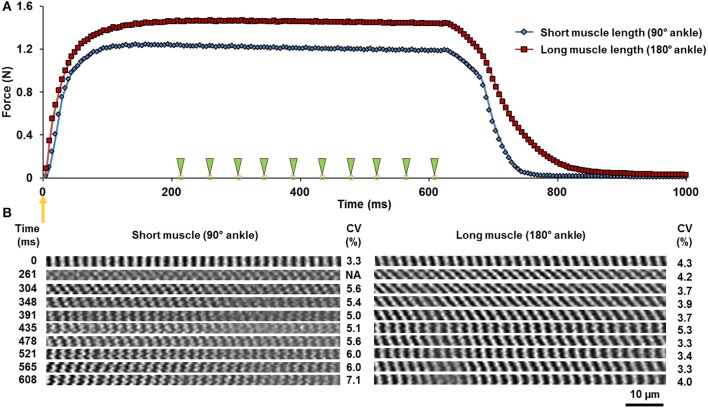
Figure 2.
(A) Force-time curve during a 600 ms tetanic isometric contraction of the TA at the short (blue diamonds) and the long (red squares) lengths. The orange arrow indicates the time of muscle activation. The green arrowheads point to the times at which sarcomere images were acquired. (B) The corresponding time-series of the two-dimensional image bands of sarcomeres in the relaxed (0 ms) and the activated state. The A-bands appear as white bands in the images. The coefficients of variation (CV) of sarcomere lengths are shown for each image band. Note that the image band acquired at time 215 ms was excluded due to the image quality not meeting the selection criteria described in Methods In Vivo Imaging of Muscle under Relaxed and Activated Conditions.

