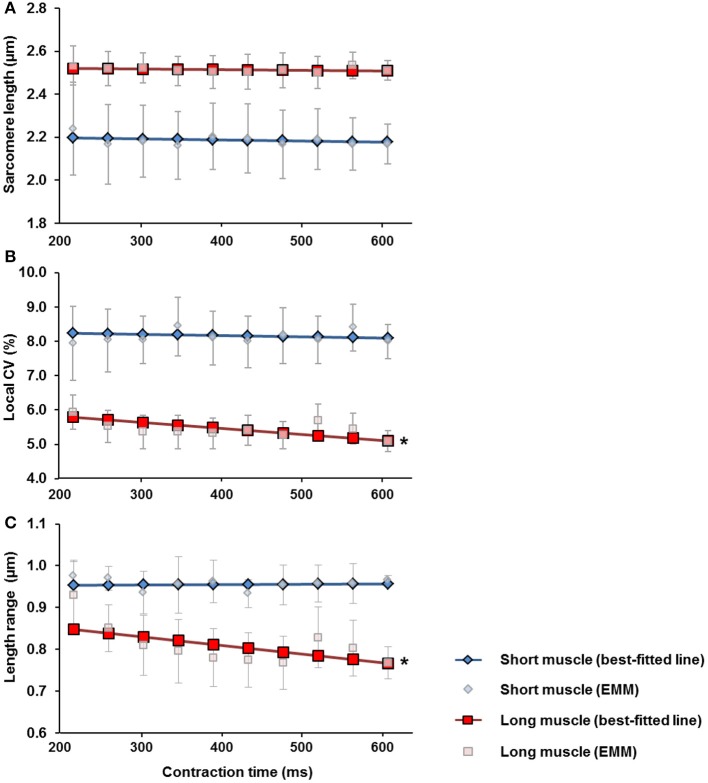
Figure 5.
Changes of (A) the mean sarcomere length (SLs), (B) the local coefficient of variation (CV) of SLs and, (C) the SL range, over the 600 ms contraction period measured at the short (blue diamonds) and the long (red squares) muscle lengths. For both muscle lengths, the mean SLs remained constant throughout the contraction period. For the short muscle, the local CV and SL range stayed constant during the 600 ms contraction period. For the long muscle, the local CV and the SL range decreased by ~12% and ~9%, respectively throughout the 600 ms contraction period. *Indicates significant relationship between contraction time and local CV, as well as between contraction time and SL range (p < 0.05). EMM-estimated marginal mean.

