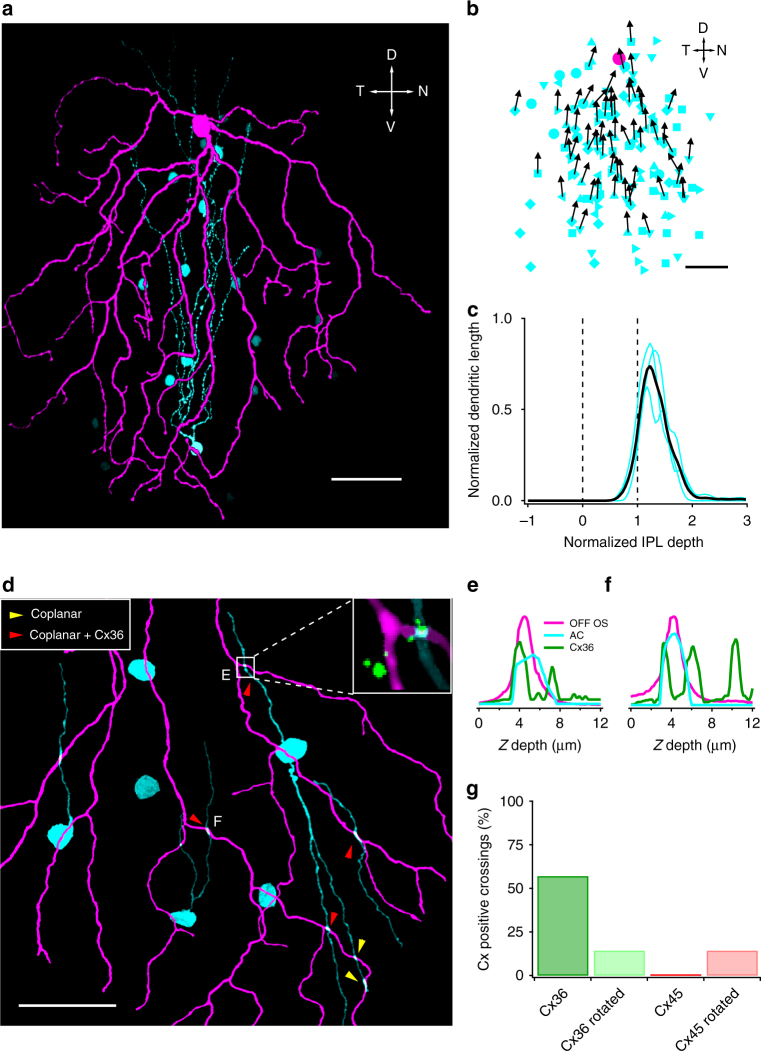
Fig. 3.
Electrical coupling between OFF OS RGCs and amacrine cells. a OFF OS RGC (magenta) and neurobiotin coupled amacrine cells (cyan). One of the coupled cells is traced. Scale bar = 50 μm. b Positions of amacrine cells coupled to OFF OS RGCs (cyan symbols). Different cyan symbols indicate cells from different experiments (n = 131 cells total from seven RGCs). Amacrine cells are plotted with respect to the RGC (magenta circle). Directions of primary dendrites are shown in black arrows when they were visible. Scale bar = 50 μm. c Stratification of coupled amacrine cells dendrites in IPL. Cyan lines indicate profiles of individual amacrine cells. Black line represents mean across three cells. Dotted lines indicate ON and OFF starburst planes. The inner nuclear layer (INL) is located to the right and the ganglion cell layer (GCL) is located to the left. d Magnified view of an OFF OS (magenta) and amacrine cell (cyan) coupled network. Yellow and red arrowheads indicate coplanar dendrite crossings and coplanar dendrite crossings positive for connexin 36 (Cx36). Inset shows an example crossing with Cx36 puncta. Scale bar = 50 μm. e, f Z-axis profiles of fluorescent intensities for OFF OS, amacrine cell dendrites and Cx36 puncta. g Percentage of coplanar crossings that are connexin positive. A total of 58% (4/7) coplanar crossings were Cx36 positive and 0% (0/7) were Cx45 positive. A total of 14% (1/7) coplanar crossings were positive for either Cx36 or Cx45 when the connexin channels were rotated by 90°

