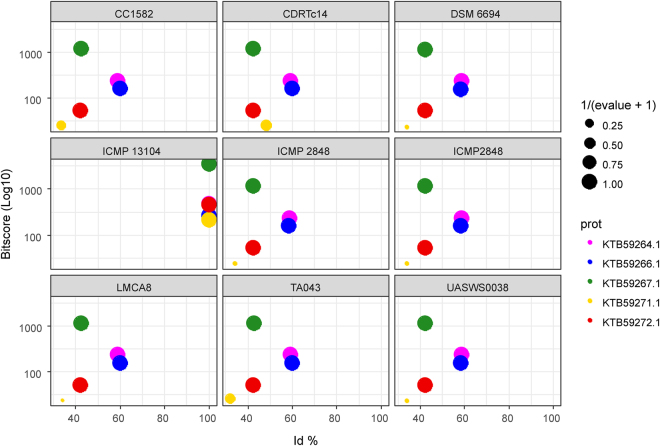
Figure 7.
BLAST plot of P. viridiflava strains tested for the presence of the pathogenicity island of type III secretion system, where strain ICMP 13104 was used as a reference. For this purpose, a tBLASTn search was performed using the gene products of the pathogenicity cluster against the P. viridiflava genome nucleotide sequences. The scatter plot shows the similarity percentages on the x-axis and the bitscores on the y-axis for each genome, whereas the e-values were transformed as 1/(evalue + 1) so that the size of each point representing a gene product could correlate positively with the e-value significance.

