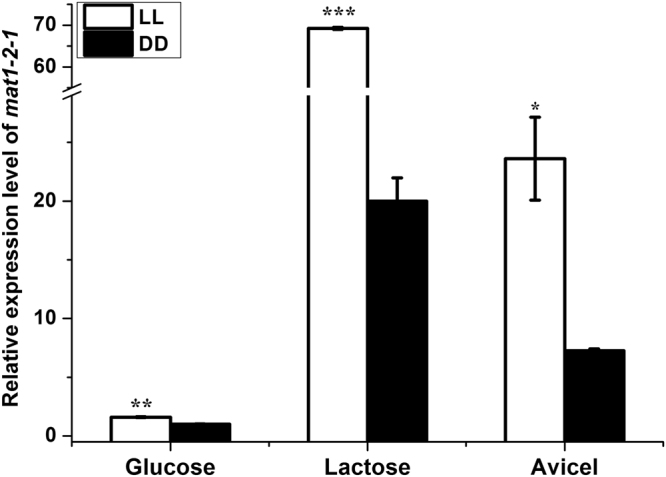
Figure 3.

Transcription of mat1-2-1 under different cultivation conditions. qRT-PCR analysis of the relative transcription level of mat1-2-1. The mean values of each column were obtained from three independent biological replicates. Error bars indicated the standard error (SE) from three independent biological replicates. Significant differences (T-test *P < 0.05, **P < 0.01, ***P < 0.001) were detected for the transcription of mat1-2-1 when comparing light and darkness for the indicated inducing carbon sources.
