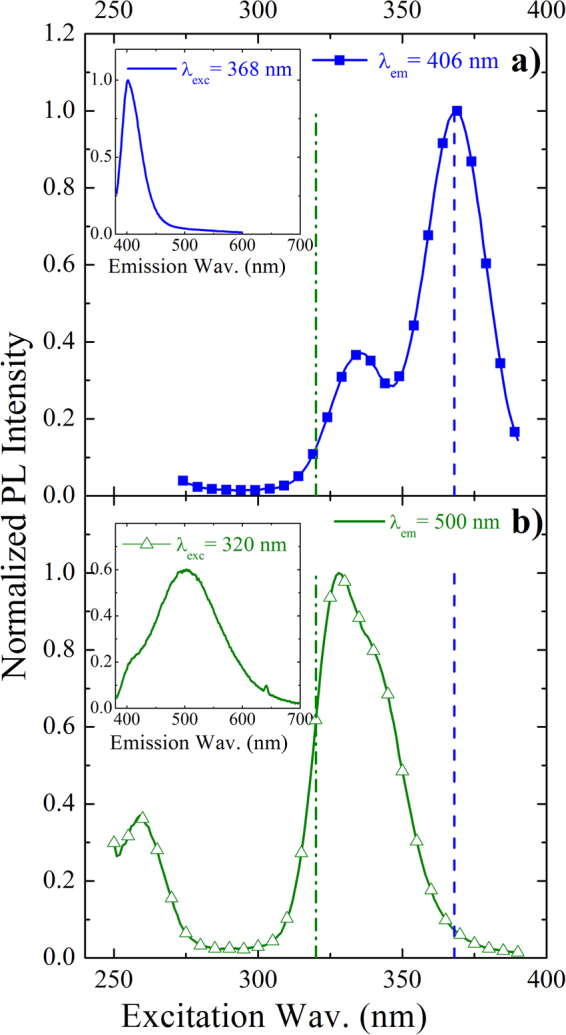
Figure 2.

Excitation and emission spectra of two Bi sites. RT normalized PLE spectra from Y2O3:Bi recorded at two different emission wavelengths: (a) at 406 nm, related to Bi3+ ions in C2 sites and (b) at 500 nm, related to Bi3+ ions in S6 sites. The relative emission bands of Bi under (a) 368 excitation wavelength and (b) 320 nm excitation wavelength are also shown as insets. The two chosen excitation wavelengths for the inserts are also indicated in the main panels as dashed lines.
