Figure 1.
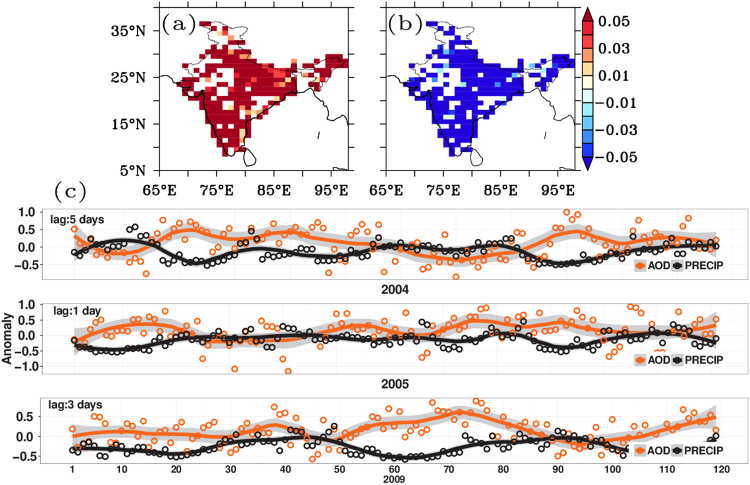
HL cluster pixel distribution and co-variability of AOD-Precipitation: Spatial distribution of pixels with high AOD and low precipitation anomaly along with cluster averaged temporal series for individual years: (a) and (b) Seasonal averaged spatial distribution of HL overlapping clusters for years 2004, 2005 and 2009 for AOD and precipitation respectively. (c) Cluster averaged time series over HL cluster (precipitation shifted by lag corresponding to maximum correlation magnitude). The composite plot of pixels shows that the high AOD-low precipitation covers wide area across the country. In the time series plot between AOD and precipitation anomaly, precipitation anomaly was shifted by the lag corresponding to maximum correlation coefficient magnitude. Multiple instances of enhanced AOD associated with suppressed precipitation can be seen in Fig. 1(c). Figure was created using R statistical tool v3.3.1 (https://www.r-project.org/) and FERRET v7.0 (http://www.ferret.noaa.gov/Ferret/).

