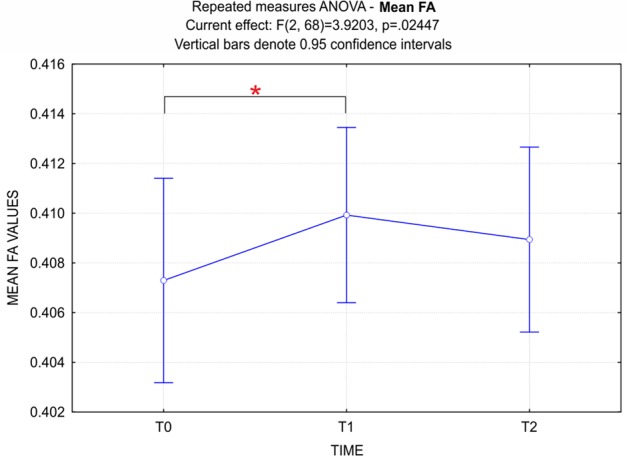
FIGURE 5.

ANOVA repeated measures - Time (3) factor for mean FA values. Data show a significant principal effect for the Time factor. Bonferroni post hoc correction showed that FA values at T1 were significantly higher than at T0 (p < 0.05). It should be noted that, although not significantly different, FA values at T2 were lower than at T1.
