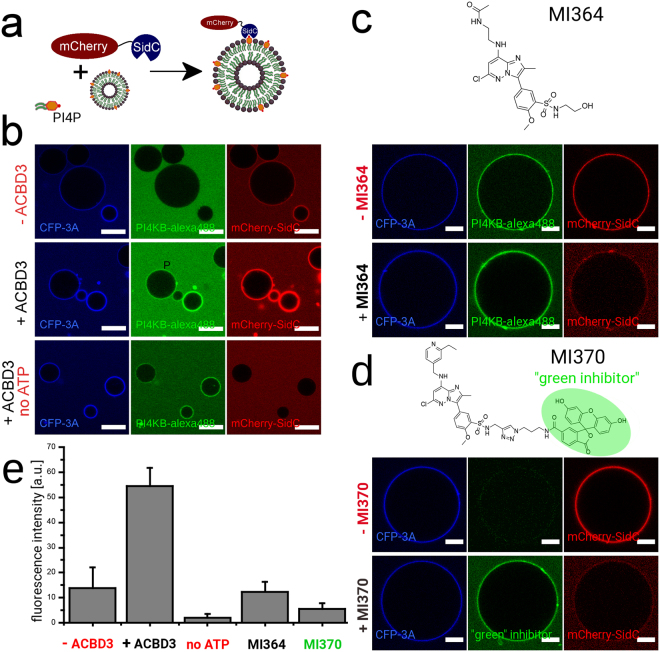
Figure 3.
PI4KB is activated in the 3A:ACBD3:PI4KB protein complex. (A) Scheme of the experiment. A PI4P binding domain from the Legionella pneumonia SidC protein that binds to PI4P with nanomolar affinity was fused to mCherry and used as a fluorescent PI4P biosensor. (B) Production of PI4P on the surface of GUVs. Upper panel: GUVs decorated with the viral 3A-CFP protein (250 nM) were incubated with Alexa488 labeled PI4KB (250 nM) and SidC-mCherry (100 nM) and imaged using a confocal microscope. Middle panel: As above but also ACBD3 (250 nM) was also added. Lower panel: As the middle panel but no ATP was added. The CFP-3A signal is in blue, the PI4KB-Alexa488 signal in green and the mCherry-SidC signal is in red. Representative image of three independent experiments. Scale bar = 20 µm. (C) Inhibition by the compound MI364. On the top is the chemical structure of MI364. On the bottom is a representative image of GUVs phosphorylated by Alexa488 labeled PI4KB (upper panel: without MI364, lower panel: with 5 µM MI364). The CFP-3A signal is in blue, the PI4KB-Alexa488 signal in green and the mCherry-SidC signal is in red. Representative image of three independent experiments. Scale bar = 10 µm. (D) Inhibition by the fluorescent compound MI370. On the top is the chemical structure of MI370 (the fluorescent part in highlighted in green). On the bottom is a representative image of GUVs phosphorylated by unlabeled PI4KB (upper panel: without MI370, lower panel: with 5 µM MI370). The CFP-3A signal is in blue, the MI370 signal in green and the mCherry-SidC signal is in red. Representative image of three independent experiments. Scale bar = 10 µm. (E) Quantification of PI4P production. Quantification of the intensity of fluorescence of the SidC-mCherry PI4P biosensor on the surface of GUVs was. Standard deviations are based on three independent experiments.

