Fig. 5.
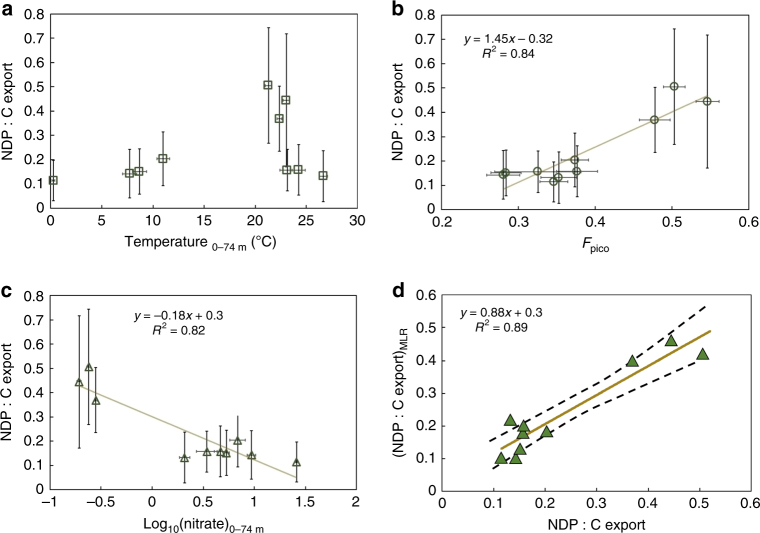
Regional relationship between DOC production:C export and several environmental parameters. Our diagnosed NDP:C export in the upper 74 m is plotted against regionally averaged temperature (a), F pico (fraction of picoplankton) (b) and log10(nitrate) (c). The diagnosed NDP:C export ratios can be explained using a multilinear regression (MLR) model with two predictor variables (F pico, and log10(nitrate)) (d). Error bars in a–c indicate ±1 standard deviation. Dashed envelope in d is the 95% confidence interval of the MLR prediction

