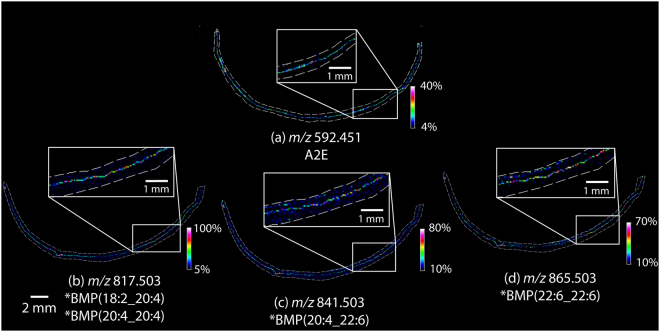
Figure 6.
MALDI IMS analysis of 82 year old human retina tissue. (a) MALDI IMS data in positive ion mode displaying the relative abundance of A2E at m/z 592.45. MALDI IMS data in negative ion mode displaying the relative abundance of (b) m/z 817.503 (c) 841.503 and (d) m/z 865.503. Enlarged insets show zoomed in regions of RPE tissue from corresponding regions of the adjacent sections. *Identifications based on mouse tissue analysis.

