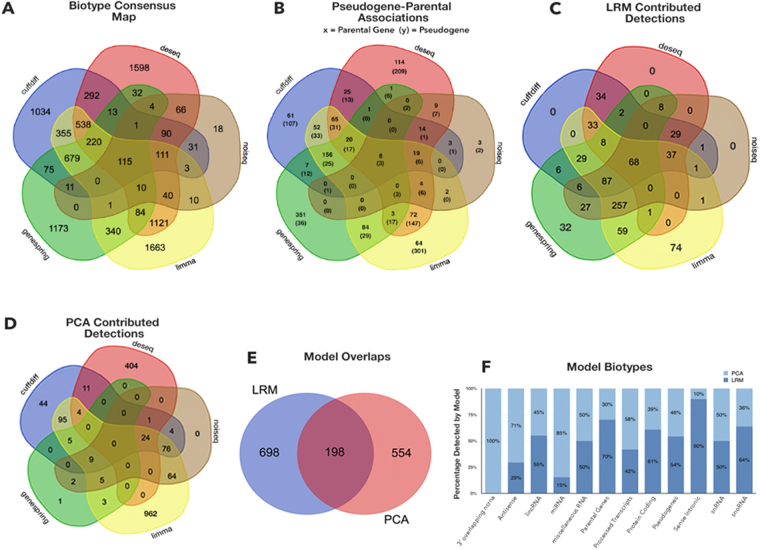
Figure 3.
Venn diagrams: multiple detection scenarios. Detections refer to all DE biotypes. (A) Overall consensus. (B) Pseudogene-parental genes detections. (C) LRM-driven detections. (D) PCA-driven detections. (E) LRM vs PCA comparison. (F) Biotype classifications in each model. Thresholded coefficients are obtained by boxplot-derived criteria: from 1.5 x IQR for LRM (Supplementary Tables 8.2.5-8), and from most outlying values for PCA (Supplementary Fig. 8.1.1-2).

