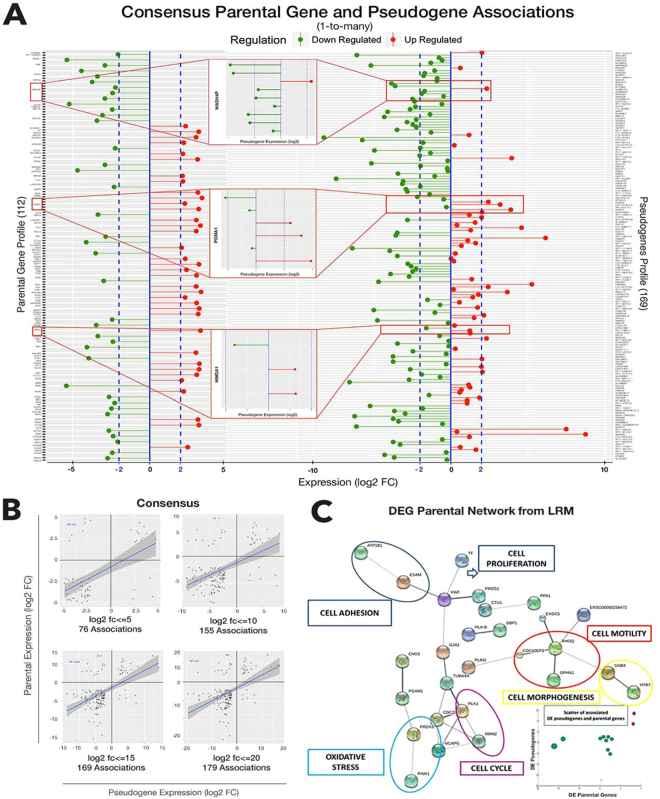
Figure 5.
Pseudogene-parental gene analyses. (A) Joint profiles of pseudogenes and parental genes from consensus (with significance bars). Insets are biotype associations examples. (B) Scatters at various expression levels, and empirical correlation patterns. (C) Protein network of DE target parental genes with associated at least expressed pseudogenes (Supplementary Fig. 8.6.3 and Supplementary Table 8.6.5). Enlarged networks in Supplementary Fig. 8.6.4.

