FIGURE 3.
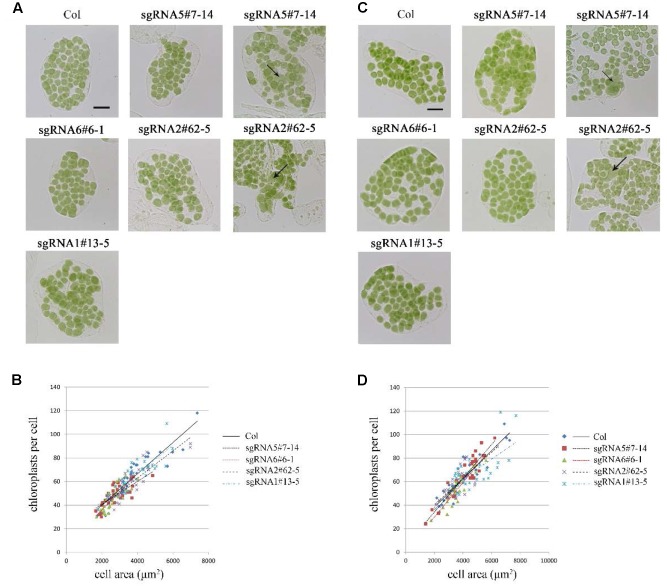
Phenotype analysis of sgRNA mutants. (A) Chloroplast division phenotypes of 3-week-old plants. Arrow indicates the enlarged chloroplast. Bar = 20 μm. (B) Relationships between chloroplast number and mesophyll cell area in 3-week-old plants. The R2 values of the best-fit lines are 0.8511, 0.5785, 0.6690, 0.7743, and 0.7173 in order. (C) Chloroplast division phenotypes of 5-week-old plants. Bar = 20 μm. (D) Relationships between chloroplast number and mesophyll cell area in 5-week-old plants. The R2 values of the best-fit lines are 0.8274, 0.8586, 0.8003, 0.6238, and 0.4595 in order (n = 30).

