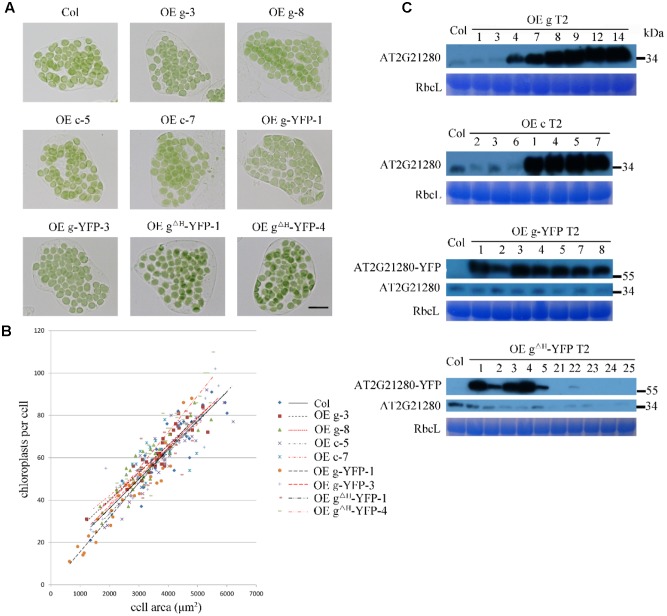
FIGURE 6.
Phenotype and protein level analysis of AT2G21280 overexpressing plants. (A) Chloroplast division phenotypes of different overexpression lines. “OE g” represents the overexpression of genomic DNA, “OE c” represents the overexpression of cDNA, “OE g-YFP” represents the overexpression of AT2G21280 fused with YFP, “OE gΔH -YFP” represents the overexpression of AT2G21280 lacking the last 20 amino acids with a C-terminal YFP fusion. Leaf tissues were sampled from 4-week-old plants. The scale bar is 20 μm. (B) Relationships between chloroplast number and mesophyll cell area of the wild type and different AT2G21280 overexpressing plants. The R2 values of the best-fit lines are 0.7814, 0.8314, 0.6333, 0.8096, 0.8238, 0.9101, 0.8457, 0.6875, and 0.8840 in order (n = 30). (C) Immunoblot analysis of the protein level of AT2G21280 in different plants. Total proteins were extracted from leaves of 4-week-old plants, and loaded in each lane. RbcL served as a loading control. The molecular weight of protein markers are labeled on the right.

