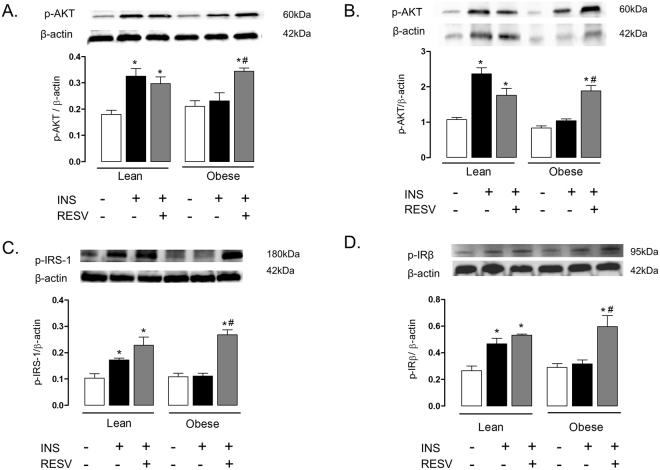
Figure 2.
Expressions of phosphorylated AKT (panels A and B), IRS-1 (C) and IRβ (D) in lean and high-fat diet-fed mice, treated or not with resveratrol (Resv; 100 mg/kg/day, 2 weeks). Phosphorylated AKT is shown in lung tissue and isolated bronchi (panels A and B, respectively). Phosphorylated IRS-1 and IRβ in lung tissues are shown in panels (C and D), respectively. Mice received an intravenous injection of insulin (INS; 1 U/animal), and within 5 min the lungs were processed. Phosphorylated proteins were normalized for β-actin. Data are expressed as mean ± SEM (n = 6). *p < 0.05 compared with respective basal (non-stimulated) group. #p < 0.05 compared with untreated obese group.

