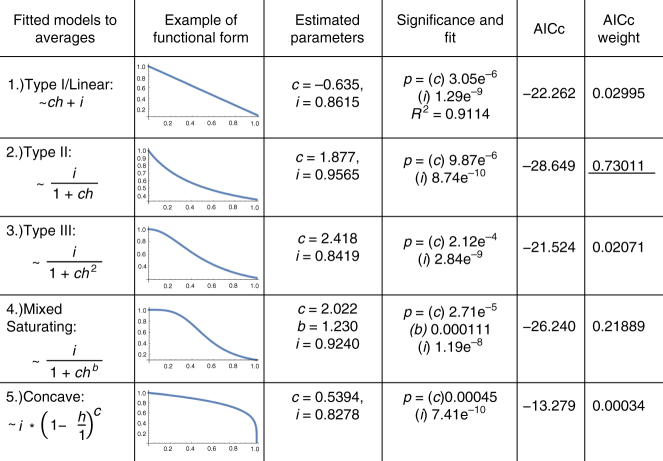
Fig. 1.
Curve fitting the five candidate response models. Describing the results of the curve fitting to the five candidate response models for v(c, h): Type I/Linear, Type II, Type III, Mixed Saturating, Concave. Here h represents the level of herbivory. The parameters c and b determine the shape of the curve and i is the intercept. Equation representations of each model are given along with a pictorial example of each model. The Type II functional response has the highest Akaike Information Criterion weight of 0.73011

