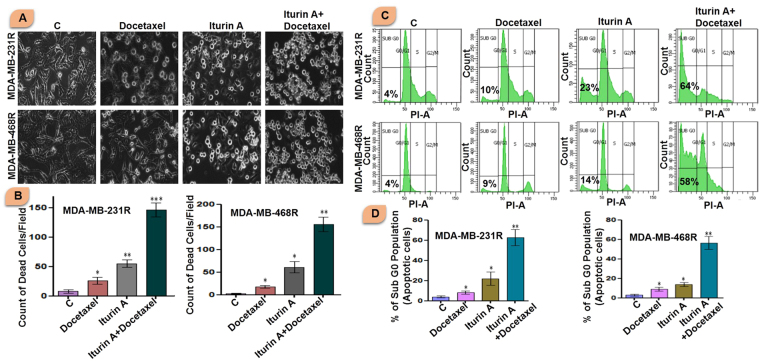
Figure 3.
(A and B) Phase contrast images resistant breast cancer cells treated with docetaxel and/or Iturin A for 48 h. Apoptotic cells were counted in each group. Resistant MDA-MB-231R and MDA-MB-468R cells were treated with docetaxel and/or Iturin A for 48 h. Bar graph represented arbitrary number apoptotic dead cells in MDA-MB-231R and MDA-MB-468R. (C and D) Flow cytometric analysis of resistant breast cancer cells treated with docetaxel and/or Iturin A for 48 h to determine DNA content based quantitative apoptotic effect. Bar graph represented apoptotic population (Sub G0) cells in MDA-MB-231R and MDA-MB-468R. In all experiments, cells were treated with Iturin A (4 µM for MDA-MB-231R and 5.6 µM for MDA-MB-468R) and docetaxel (50 nM in both resistant cells) in specific doses. The significance level was represented by *P < 0.05, **P < 0.01, ***P < 0.001.

