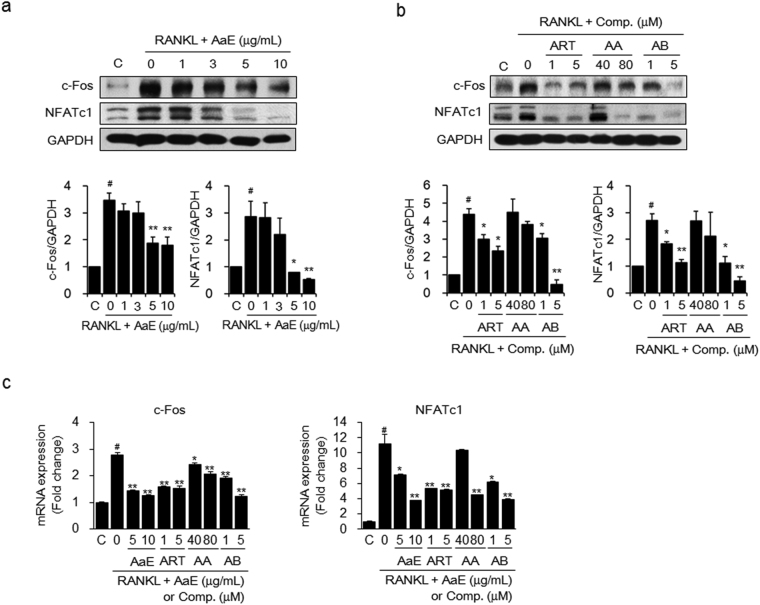
Figure 6.
AaE and its active components suppress c-Fos and NFATc1 expression in RANKL-treated BMMs. BMMs were incubated with M-CSF (30 ng/mL), RANKL (50 ng/mL), and the indicated concentrations of (a) AaE and (b) artemisinin (ART), artemisinic acid (AA), or arteannuin B (AB) for 2 days. The expression levels of c-Fos and NFATc1 were examined by western blot analysis. The band intensity of each protein was densitometrically measured with TINA software and normalized to that of GAPDH as an internal control. The images are representative. (c) The mRNA expression levels of c-Fos and NFATc1 were detected using qRT-PCR and normalized to that of GAPDH. The data are expressed as the mean ± SE of triplicate experiments. # P < 0.01 versus BMMs without RANKL (C), * P < 0.05, ** P < 0.01 versus BMMs with RANKL alone.

