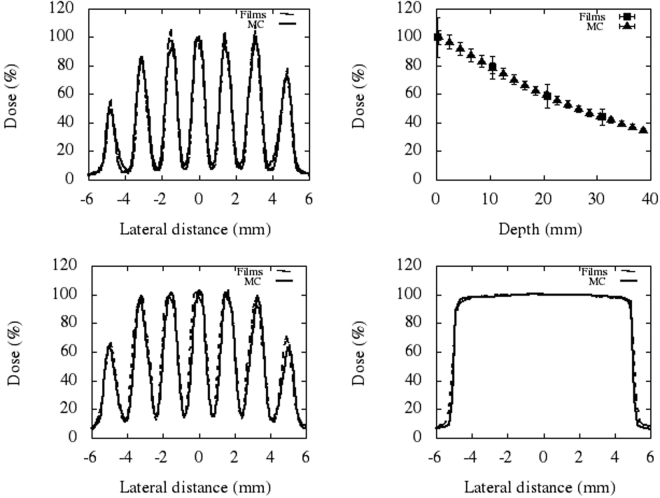
Figure 2.
Comparison of experimental and calculated lateral dose profiles. The upper row shows the lateral dose profiles at 1 cm-depth (left) and the depth dose curve (right) for the central minibeam of the thinner collimator (FWHM of the central peak is 696 ± 20 μm at 1 cm-depth). The lower row depicts the lateral profiles at 1 cm-depth resulting after irradiation with the wider MBRT collimator (FWHM of the central peak is 968 ± 77 μm) and with the fixed SARPP collimator (irradiation at the isocentre).

