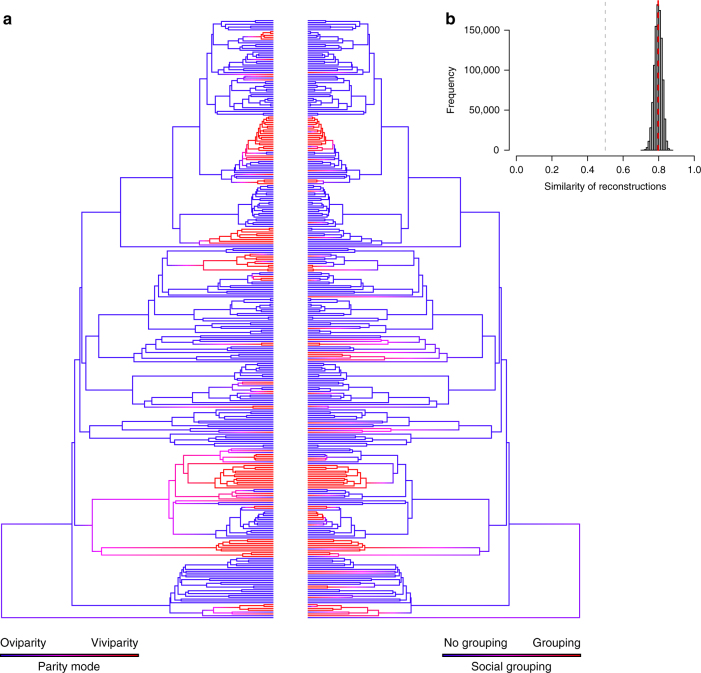
Fig. 3.
Correlated evolution of viviparity and social grouping among squamate reptiles. a Ancestral state reconstructions of parity mode and social grouping by stochastic character mapping. Phylogeny restricted to species in the ‘conservative’ data set (n = 324, see Methods for details). Branch colours represent posterior probability densities of edge states based on 1000 stochastic character maps of each reconstruction. b Distribution of similarity scores between stochastic character map sets based on separate ancestral character state reconstructions of parity mode and social grouping. The grey line represents the null expectation of similarity between map sets assuming parity mode, and social grouping shows no evolutionarily correlation during reconstruction65. The red line represents the mean similarity between map sets based on our reconstructions

