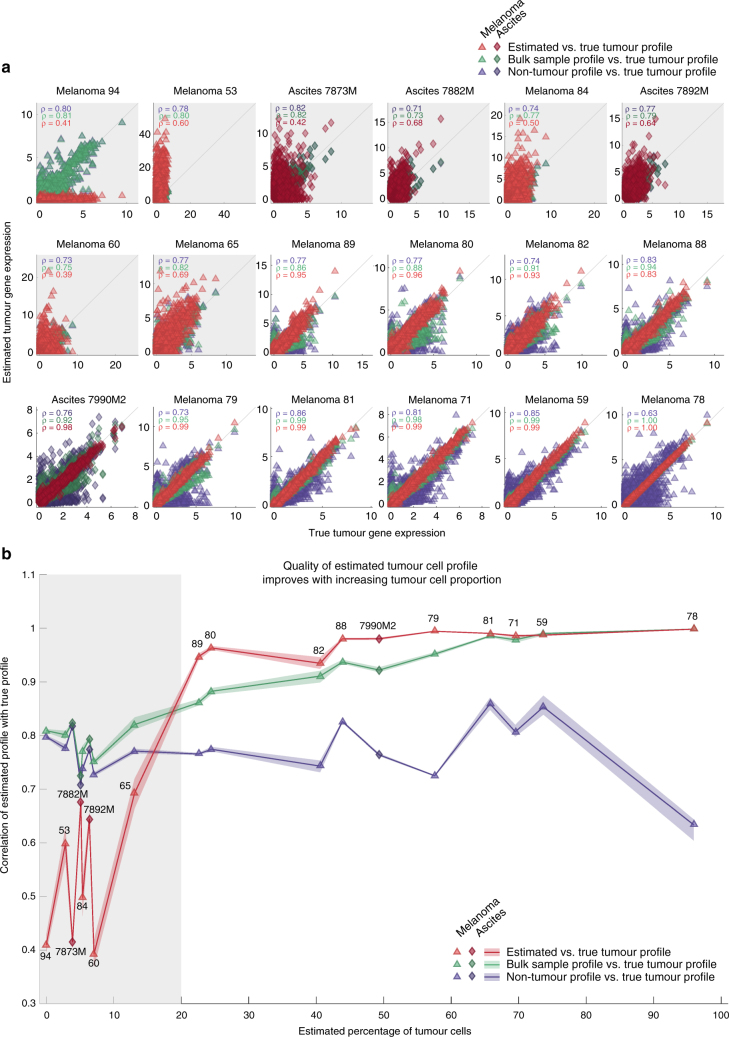
Fig. 7.
Estimation accuracy of patient-specific tumour cell gene expression profiles. a Scatter plot of estimated vs. true transcriptome wide gene expression (17,933 genes) of the tumour cells for individual patient samples. Patient samples without any tumour cells have been excluded from this analysis. ρ denotes the Pearson’s correlation. Correlation plots with grey background indicate patient samples with less than 20% tumour cell content. Colours according to legend in panel b. b Correlation values from panel a plotted against the estimated proportion of tumour cells for each patient sample. Shading represents uncertainty based on bootstrapping. Symbols and numbering denote individual patient samples

